


Good morning,
Topics covered include:
Daily Stats
-Key Points
-Data table
-Sectors
-Index breadth
-Best/Worst 20
Market
-Trading boxes
-RSI Divergence
-MACD
-GoNoGo
-Three live bullish patterns
-Potential bearish pattern
Key Charts
-XLK Technology (2)
-ARKK
-SMH Semis
Chart Trades
-SMCI
-AMD
-EXC
Have a great Tuesday.
Best, Frank
Key Points
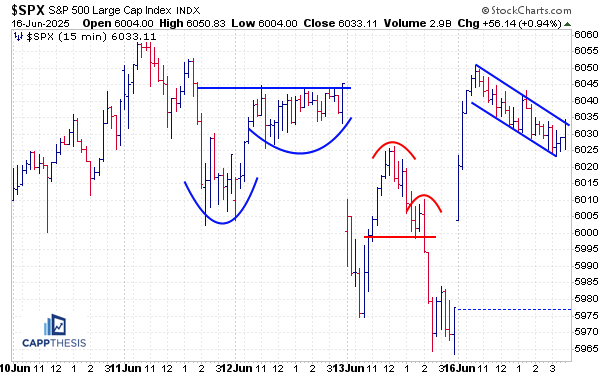
The SPX bounced back from Friday’s 1% decline with a near 1% gain on Monday. As the 5-day chart below shows, the early strength was extended upon from the open but hit a brick wall by 11:00, which prevented the index from logging an official 1% gain, as well as challenging last week’s highs.
If nothing else, this shows us that there’s been lack of follow through on both sides the last week and change. Again, with the SPX up 25% from the lows, battling the psychologically significant 6,000 zone in front of tomorrow’s FOMC meeting, amongst the backdrop of the mid-east conflict, the recent pause has been the best-case scenario.
In today’s market section, we’re discussing three important SPX charts we should all be watching the rest of this week.
Last Five Trading Days
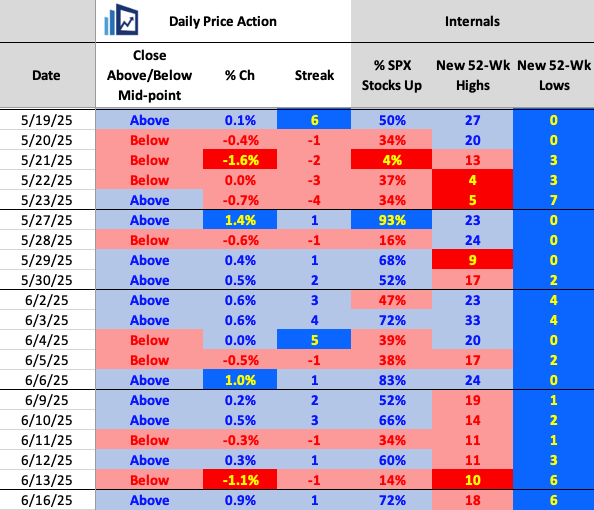
Daily Price Action
While the SPX finished off its highs yesterday, it still closed above its intra-day midpoint and had over 70% advancing stocks. The snapback also prevented seeing two-straight down days, which last happened from 5/20-5/23 (four straight).
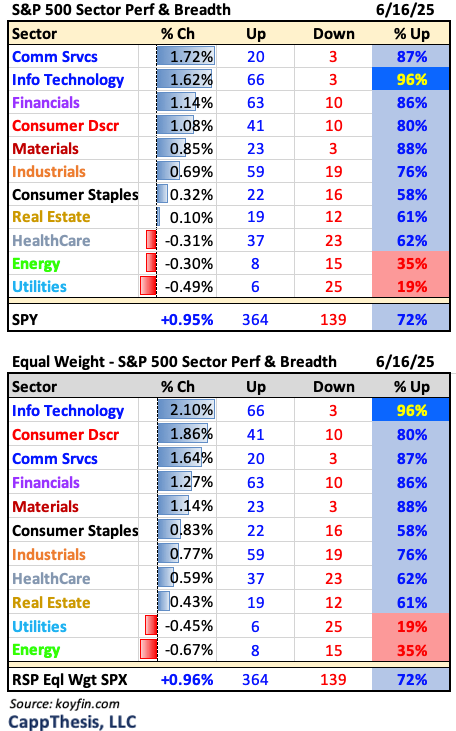
Sectors
Yesterday’s sector performance and breadth statistics tell us that it was a risk-on session, with leadership from the growth sectors and financials. Energy took a breather, but Crude is trading higher again this morning.
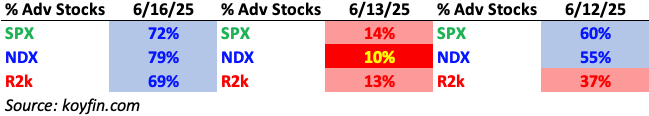
Breadth
Market internals were solidly positive across the board yesterday. The NDX did the best, as nearly 80% of its holdings logged gains.
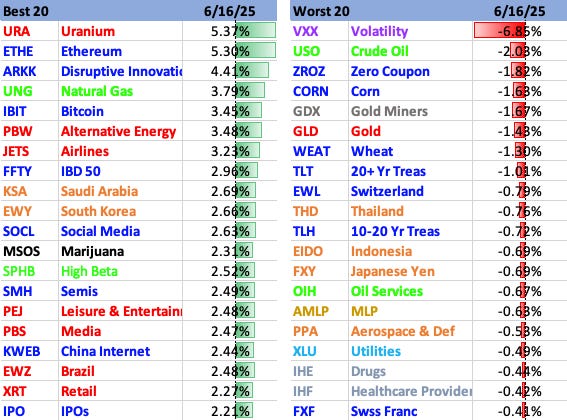
Best & Worst 20 ETFs
Uranium continued its recent spike on Monday, with Ethereum, ARKK and Bitcoin ETFs right behind it. Bonds, foreign ETFs and healthcare lagged.
Three Key SPX Charts
The most important charts we show every day are the classical patterns. That will always be the case, as the success or failure of breakouts and breakdowns ultimately determines the market’s trend. We’ve seen this play out time and again—especially in 2025…
Beyond the classical patterns, though, we feature a variety of supporting charts every day here. These aren’t just complementary—they provide critical context and clues about the probability of those patterns playing out.
Here are three that we’re watching closely now.
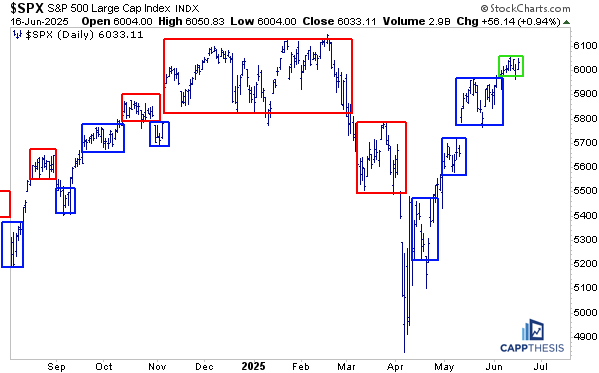
Trading Boxes
Trading boxes are patterns too—just not in the classical sense. They’re useful because they define the upper and lower boundaries of a trading range, which tends to appear when the market is in digestion mode. And while it might not feel like it, the market has experienced several such phases since the lows. Drawing boxes around price action is a simple and effective way to highlight that.
As the SPX has returned to the 6,000 level, the current trading range has tightened. Still, it’s worth tracking closely. The index has already recorded three consecutive trading breakouts. If we see a fourth this week, it will strengthen the case for the bullish classical patterns currently forming—and the opposite would be just as telling.
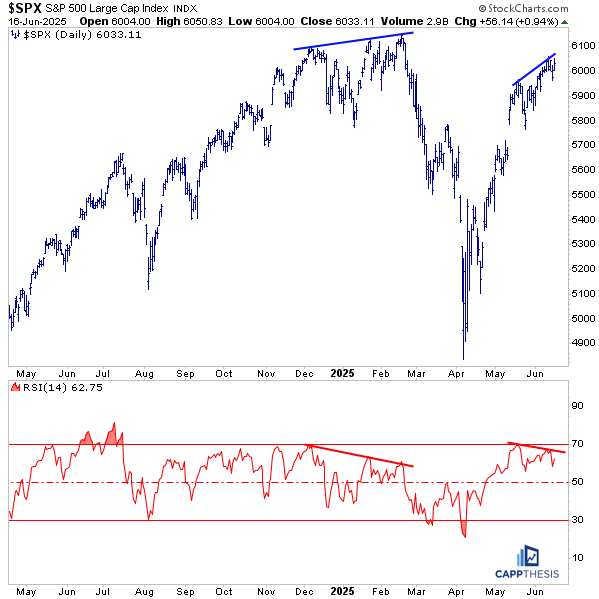
RSI Negative Divergence
Despite the SPX grinding higher and posting new short-term highs over the past two weeks, the 14-day RSI has been making lower highs. That’s a negative divergence—often a sign of slowing momentum that could lead to lower prices.
This type of divergence is common during digestion phases, which the market appears to be in now. But we’ve seen this before: a similar RSI divergence from December through mid-February correctly flagged internal weakness before the market rolled over. We now know why that selloff happened—but as long as this condition persists, it’s worth watching closely.
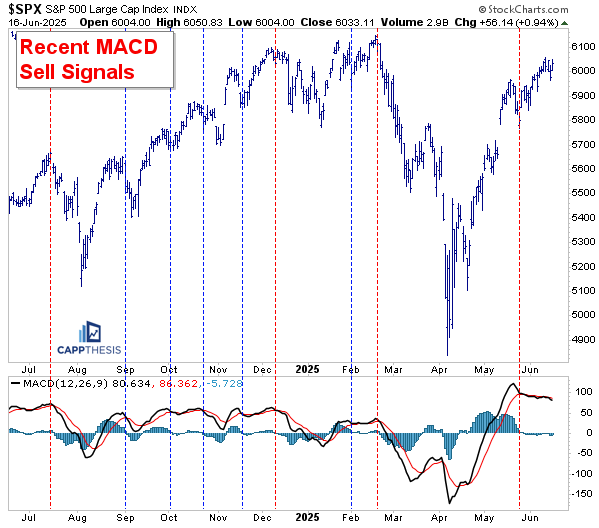
MACD Sell Signal
The third key chart is the MACD, which we’ve been tracking since it began to roll over in late May. It’s been flashing a sell signal for three weeks now, though that signal has yet to materialize in price.
What makes the current setup unusual is the MACD’s starting point—it’s coming off an extremely elevated level following the market’s sharp rebound. As the SPX continues to drift higher, the moving averages that make up the MACD have also crept higher, keeping the black and red lines close to each other.
We’ll get a clearer confirmation of a true sell signal when those lines finally separate—and for that to happen soon, the SPX will need to show more meaningful weakness.
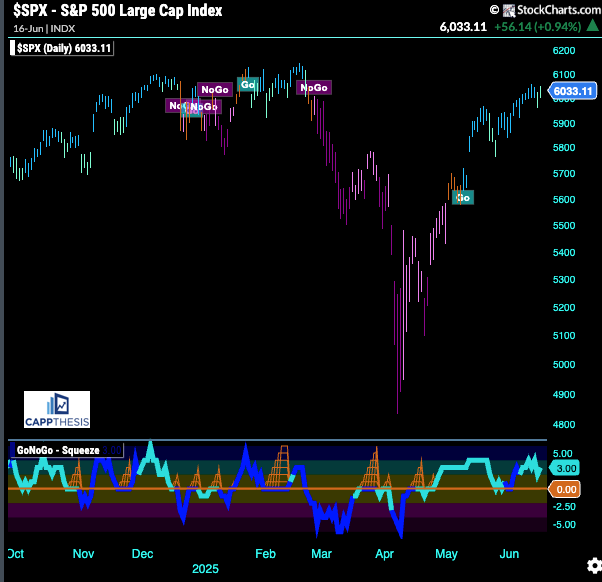
GoNoGo Trend
The SPX remains in a bullish trend heading into today’s session.
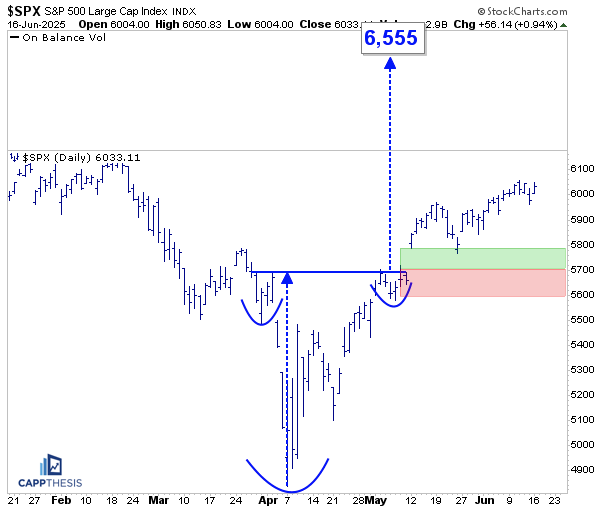
Patterns
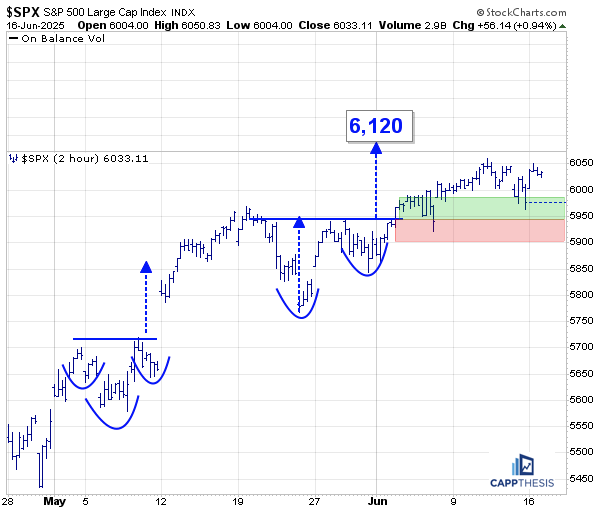
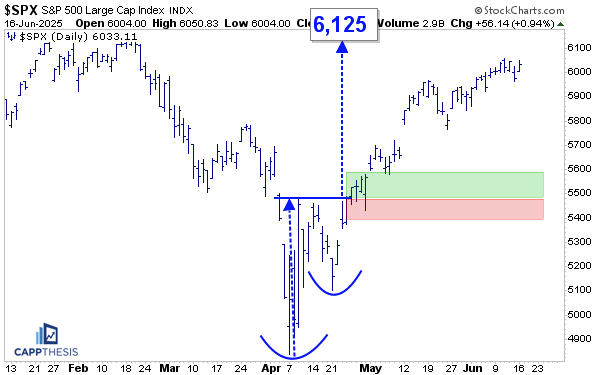
The same three live bullish patterns remain alive, targets 6,120, 6,125 and 6,555, respectively.
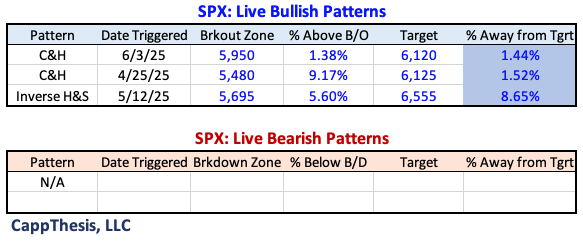
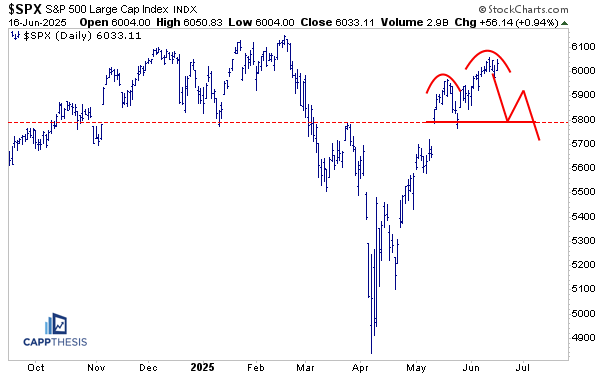
We’re still keeping an eye on this potential bearish pattern, which would become clearer on any sell-off greater than we’ve seen lately.
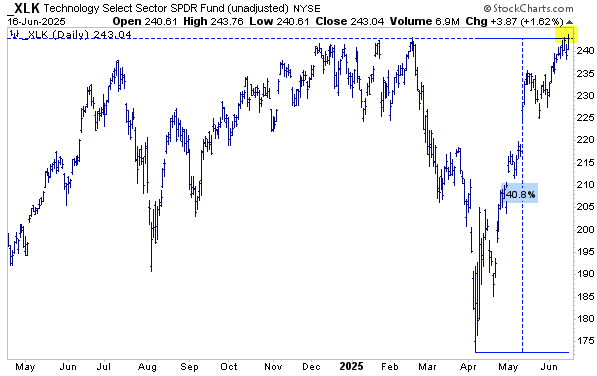
XLK Technology
The XLK ETF was up another 1.6% on Monday, which puts the move from the low at +41% in about nine weeks. Incredible. The ETF also made a new ALL-TIME HIGH yesterday, completing the massive 180-degree turn. So, what are the odds that we’ll now see even more upside? Scroll down.
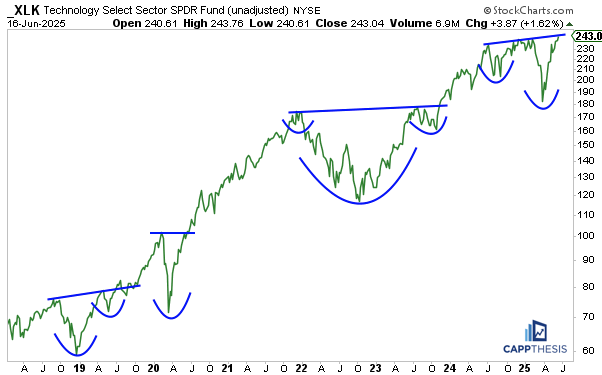
If XLK “simply” follows the path from the last three breakouts to new highs, then, yes, we could see even more upside. Having another pause before that happens could help the foundation build a bit more.
ARKK
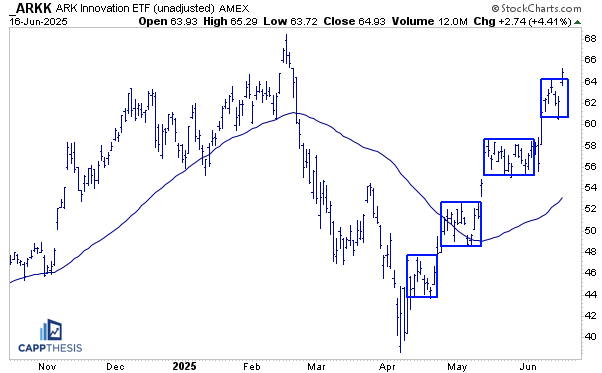
ARKK is one step ahead of the SPX when it comes to trading box breakouts. Yesterday’s 4% surge marked the fourth consecutive breakout from a consolidation range.
As with any pattern, follow-through is key for the move to hold. But so far, ARKK has been following the playbook needed to eventually retest—and potentially surpass—its February highs. And if that happens, there’s still significant upside on the table, given how far the ETF remains from its early 2021 peak.
SMH Semis
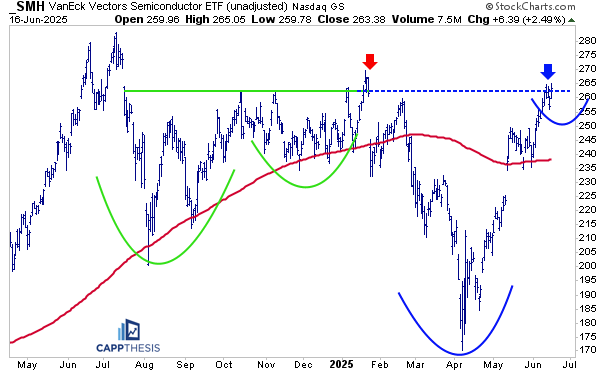
SMH is now trading above its February 2025 highs, though it remains below the January peak—and still well off its July 2024 all-time high. As we’ll recall, SMH wasted a nearly textbook bullish cup-and-handle pattern with that January head-fake (see red arrow).
Now, SMH has returned to that same level, and a new potential bullish structure is forming—this time built from a series of smaller bullish patterns off the April lows. While the move feels extended, it’s worth noting that SMH is essentially flat over the past 12 months. From that standpoint, it was far more stretched last June than it is today.
SMCI Super Micro Computer
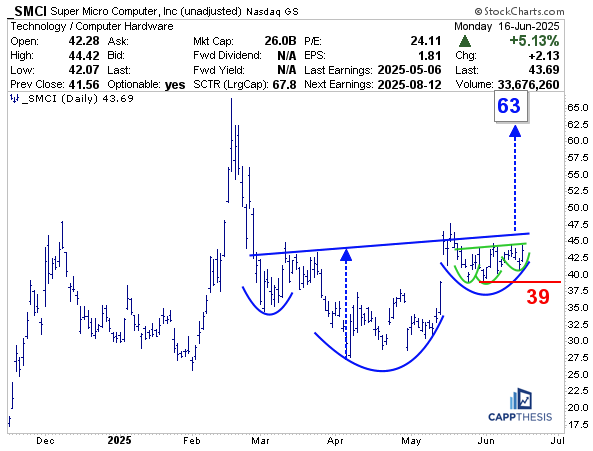
With SMH performing well, many of its components are following suit—including one of last year’s most polarizing names: SMCI.
Stripping out the emotion, the chart reveals TWO potential bullish inverse head & shoulders patterns: a smaller multi-week formation (in green) and a larger multi-month structure (in blue). A breakout above the upward-sloping neckline would project a target near 63.
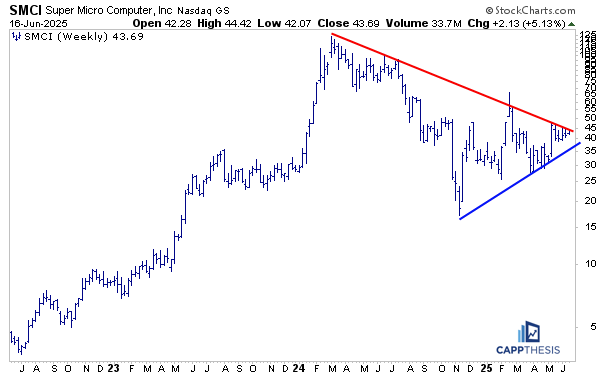
Zooming out, a breakout would also put SMCI above a very important long-term downtrend line – drawn on this long-term log chart.
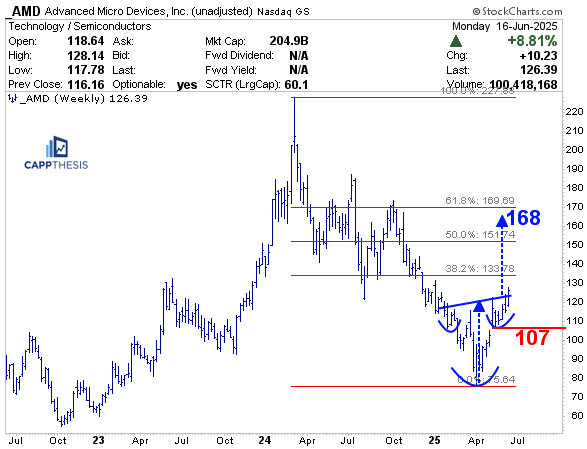
AMD Advanced Micro Devices
AMD was the best performing S&P 500 stock yesterday, up nearly 9%. And while chasing any stock up that much isn’t recommended in the short-term, that move prompted a long-term breakout on its weekly chart. Should that breakout see some follow through, the upside objective would be up at 168. That’s very close to the 61.8% retracement of the entire 2024-25 decline (170).
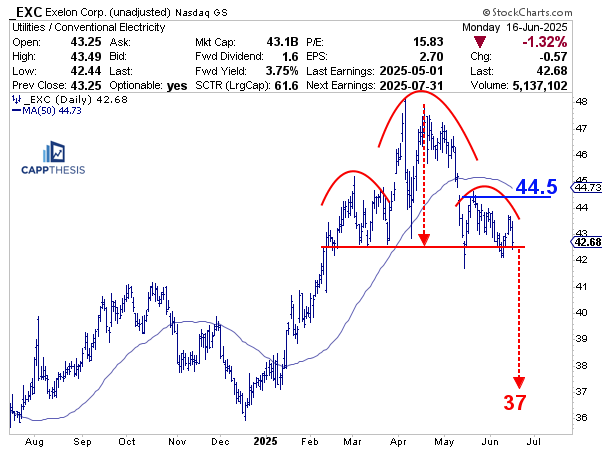
EXC Exelon
Lastly, while there aren’t many bearish patterns out there, EXC has been tracing out a large topping pattern the last few months. We trust all potential breakouts and breakdowns. Thus, if EXC falls much further, it would trigger this head & shoulders pattern. With very light support under current levels, the downside target would be near 37.
I'm not on here for all of this nonsense advice like show up, find yourself, etc.