


First published at 8:30 AM Eastern for premium CappThesis clients.
Key Points
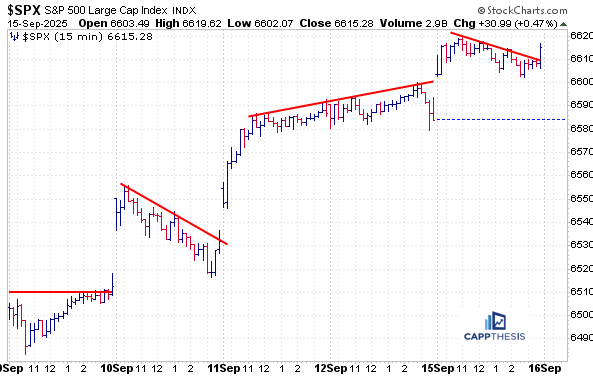
The S&P 500 bounced back yesterday, making a fresh all-time high, but didn’t do much after the first few minutes of the trading day. The knock on this advance — like several others lately — was that it came with negative breadth.
Today, we’ll be focusing on two main themes: The long streak without a 1% decline, comparing it to other periods this year. And the current stretched state of the market heading into tomorrow’s FOMC meeting.
We’ll also look at three key ETFs and three individual stocks.
Last Five Trading Days
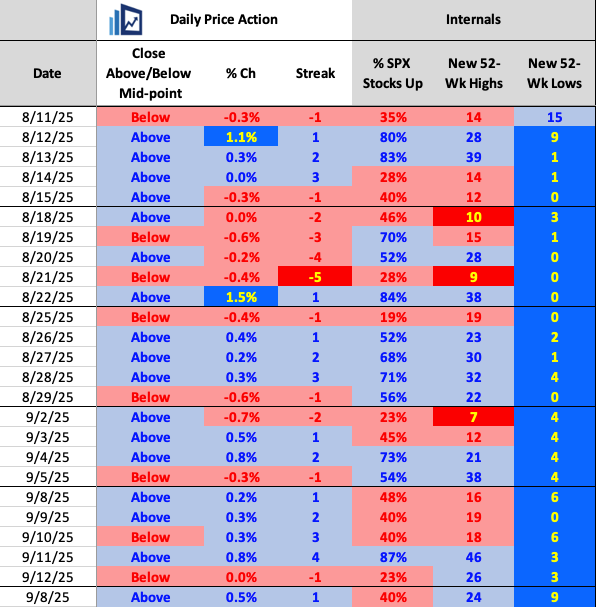
Daily Price Action
The SPX logged its fifth advance in the last six days, but also endured its fifth negative breadth session over that same stretch — an obvious concern if this trend continues. The only positive breadth day was last Thursday, when the S&P gained 80 bps with nearly 90% breadth.
We also still haven’t seen a surge in new 52-week highs — the last time this number was above 50 was back on July 23. While this hasn’t slowed the broader market advance, it remains an important metric to keep an eye on.
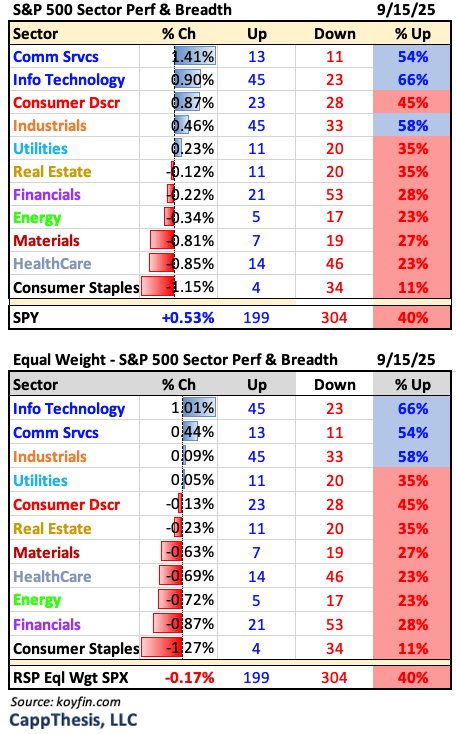
Sectors
Three sectors posted positive breadth yesterday — and they were important ones: Communication Services, Technology, and Industrials. This leadership allowed the S&P 500 to squeak out a gain, though the result was different for the RSP equal-weight ETF, which dropped nearly 20 bps.
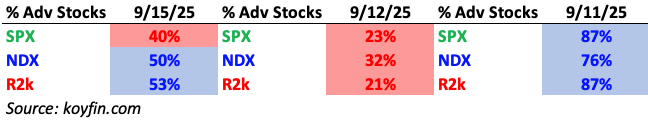
Index Breadth
The S&P 500 underperformed from an internal perspective, with just 40% of its stocks advancing, compared to 50% for the NDX and 53% for the Russell 2000 small-cap index.
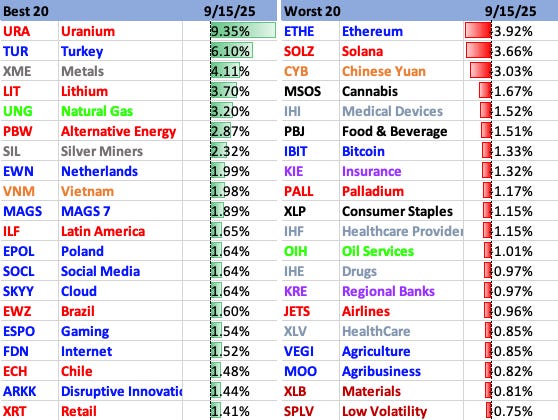
Best & Worst 20 ETFs
On Yesterday, the URA ETF emphatically broke out of the bullish pattern we’ve been eyeing. We also saw strong moves from select European ETFs and alternative energy, as well as growth.
On the downside, crypto overall lagged, along with Consumer Staples, Healthcare, and Financials.
30 Days
If you haven’t heard, the SPX is making new highs, hitting upside targets and continuing to do so with very little profit taking. As we discussed in detail during last week’s monthly webinar, the two-way volatility has been non-existent.
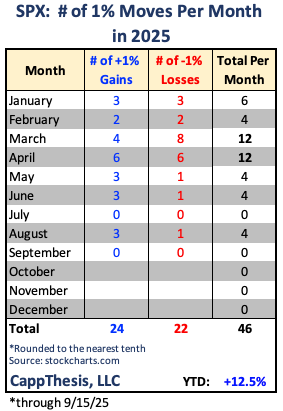
While seeing the explosiveness from the lows morph into a calmer, more consistent uptrend hasn’t been a surprise, witnessing how long the advance has persisted with nary a dip has raised a few eyebrows. In July, the index had ZERO 1% moves – up or down.
In September – so far – the SPX has, again, yet to log a 1% gain or loss. With the rate cut and press conference on deck tomorrow, very few market participants expect this calm to persist much longer…
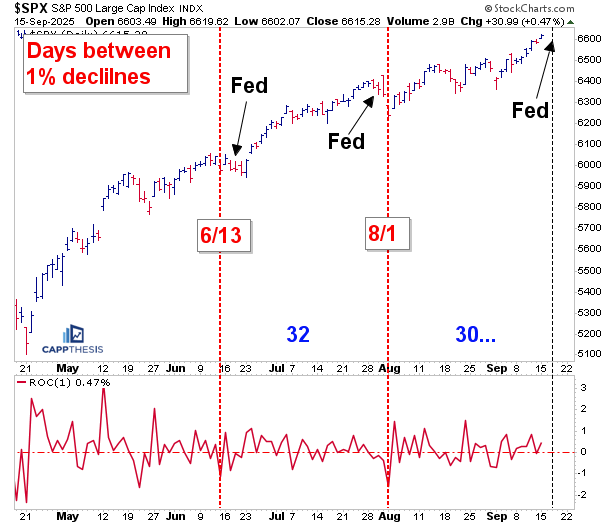
Here’s one reason: it’s been 30 trading days since the last 1% decline, which happened on August 1st. That big 1.6% loss occurred two days after the last Fed meeting (7/30), and it followed a big negative reversal the session prior.
Again, that happened right after July (no 1% moves). In total, the index went 32 trading sessions without a 1% decline back then… and was making new highs right up until the FOMC’s rate decision day.
Going back even further, the last 1% decline BEFORE that was 6/13, which occurred just three trading sessions prior to the June 18 Fed meeting.
The similarities are clear…
And with EVERYONE talking, sharing and posting about the worst two-week seasonality period now being upon us (the second half of September), it appears like a classic sell-the-news setup.
Throw in the fact that the SPX is overbought again and that the NDX (and others) are up nine straight days (more on this in the Key Charts section), there’s not much to argue about.
We’re at a stage, once again, where both bulls and bears expect a pause in the action.
Specifically, bears expect a crash (or at least a violent, bigger pullback than we’ve seen lately). Bulls want a better entry point for new longs.
This combination has presented itself before, and the market has complied with small dips each time.
As noted yesterday, with the two-hour chart now overbought too, this all makes sense.
Indeed, we’ve seen this before – in 2017, the index logged just four 1% declines all year. Let’s not forget that was year one of Trump 1.0.
And while we got a violent start to the year in 2025, it’s morphed into that kind of trading environment lately in Trump 2.0. Neither seemed likely to happen.
So, what do we do now?
The same thing we did then: track the patterns and act accordingly.
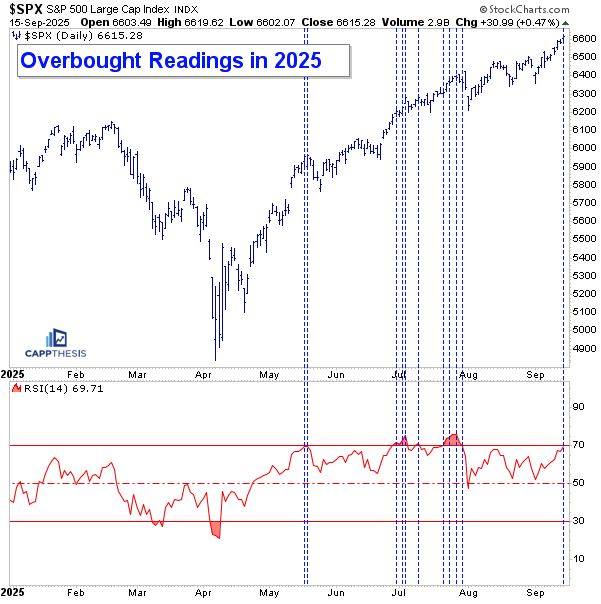
Overbought Again
The SPX’s 14-day RSI closed at 69.71 yesterday, which — rounded up — places it in overbought territory. This marks the third month in the last four with at least one overbought reading (May, June, July).
Ironically, it’s also the first time the RSI has grazed 70 since the last FOMC meeting.
Each prior instance saw the SPX pause, pulling the indicator down as well. Notably, none of those dips exceeded 3.5%, and the RSI has only slipped below 50 once (on 8/1). In other words, overbought is a condition of a strong market. While it could be viewed as a warning sign, it is not a sell signal in and of itself.
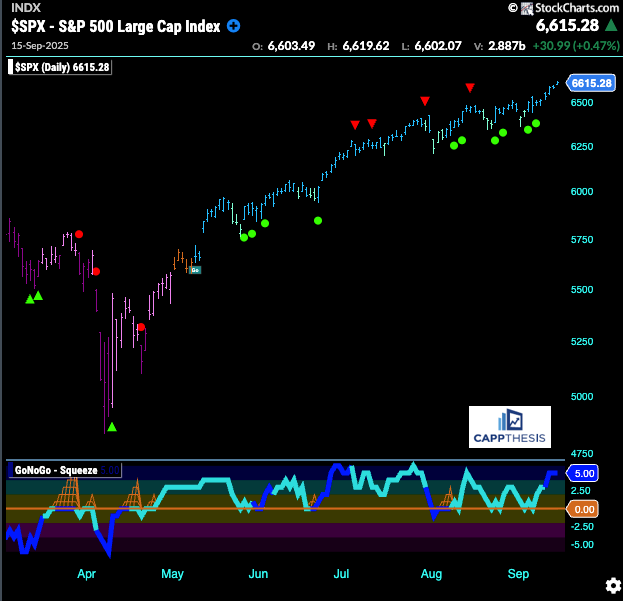
GoNoGo Trend – Daily
The GoNoGo indicator remains in a bullish trend. A dip soon would prompt another counter-trend signal (red arrow).
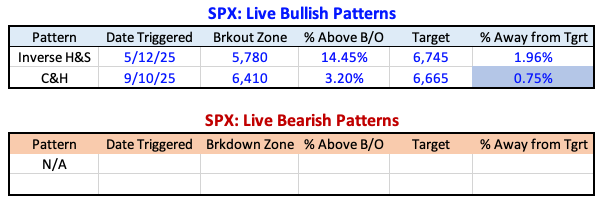
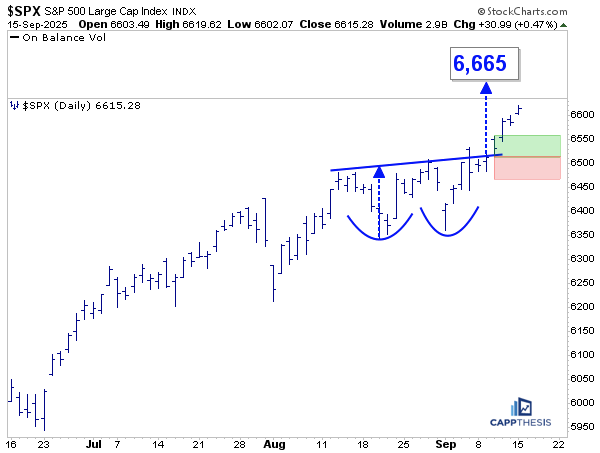
Live Bullish Patterns
The SPX starts the day within 75 bps of hitting the 6,665-target from the bullish pattern that was triggered last week.
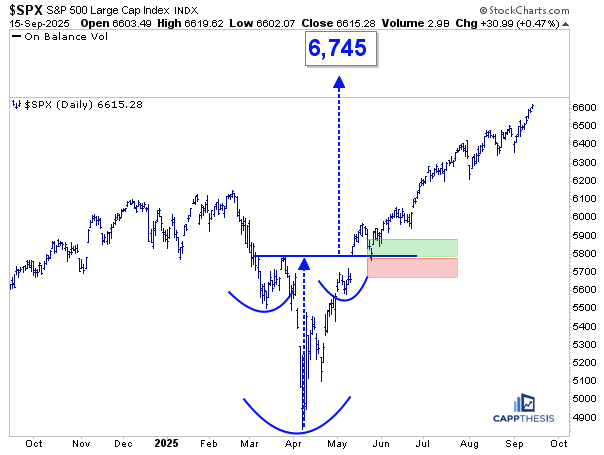
The bigger pattern, of course, remains in play. The S&P now sits roughly 14% above the breakout zone and now less than 2.5% away from hitting the 6,745-target.
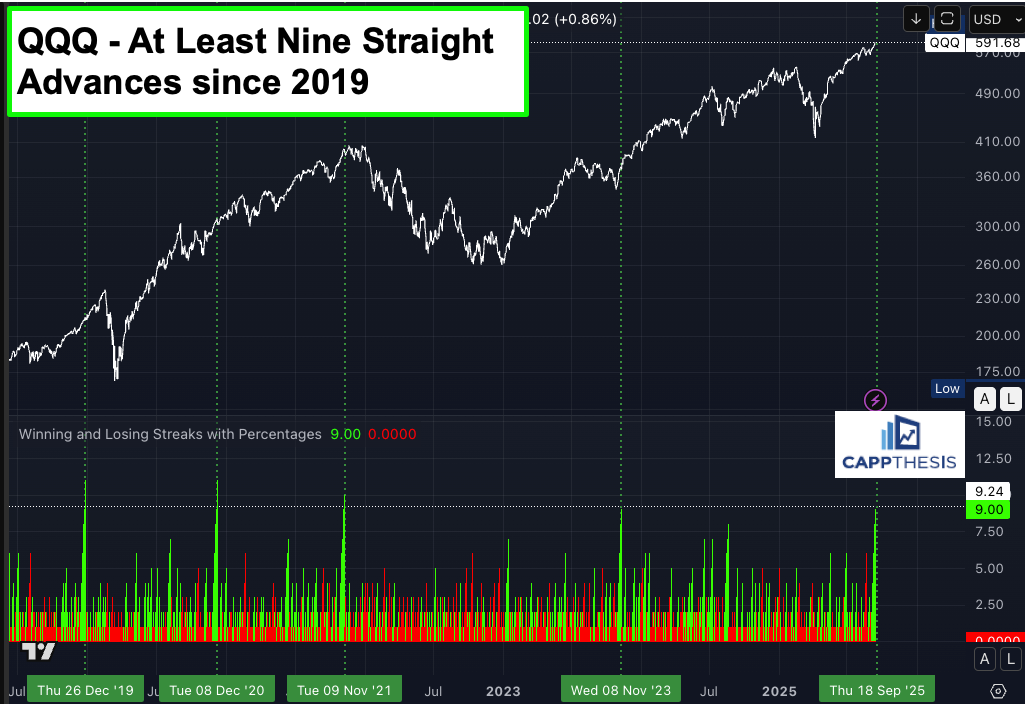
QQQ NDX 100
The QQQ ETF 9-day win streak has been well documented by now. It’s now the longest run since the period ending November 8, 2023, which was the very beginning of the strong rally that extended through late March before the first 6% pullback emerged.
Prior to that, the last streak longer than nine days ended on November 9, 2021. While the index continued to make marginal new highs through year-end, the upside proved limited with the 2022 bear market commencing soon thereafter.
Other notable periods include:
December 2020 – in the middle of the Covid comeback.
December 2019 – near the end of a very strong fourth-quarter advance, though the S&P 500 still rose for another two months through February’20.
So, there are plenty of historical examples to reference — some marking tops, others marking bottoms.
With QQQ up over 40% from the lows, we are certainly not in a bottoming phase. But if the 2020–2021 analog holds, it could suggest we’re still in the middle of a comeback with further room to run.
It’s not up to us to guess which period this most resembles. It’s more about reacting to the price action as the next pullback commences — which odds suggest could happen sooner rather than later.
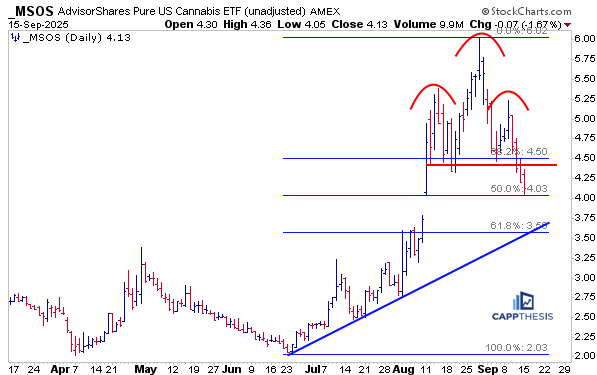
MSOS Cannabis
The huge advance in MSOS since the June bottom has been nothing short of impressive. We’ve tracked this from various angles along the way. Most recently, we noted how a failed valid bounce could form the right shoulder of a potential head-and-shoulders pattern. That pattern has now developed, with the ETF trading below the neckline.
While the ultimate target would take it much lower than current levels, there are potential stopping points along the way:
First, support appeared near the 50% retracement zone (~4.0) yesterday. Below that sits the early August gap, which coincides with the uptrend line drawn from the June lows.
Further down, the 61.8% retracement level (~3.6) represents the next key area.
So, MSOS is in a pullback phase. A stronger rally would of course require renewed demand surfacing soon, which could then help build the next bullish pattern. Up to this point, however, we remain in wait-and-see mode.
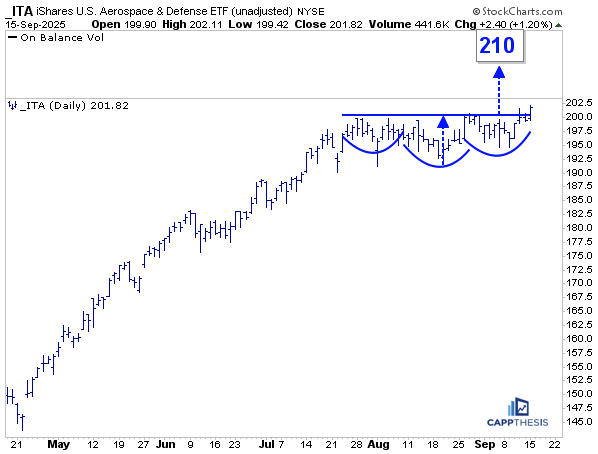
ITA Aerospace & Defense
The ITA ETF has been tracing out a potential inverse head-and-shoulders pattern since late July. Yesterday, it made a strong move that triggered the pattern, staying above the breakout zone.
Holding above the 200 level would confirm the setup and point to a modest upside target near 210 — which would mark a new all-time high.
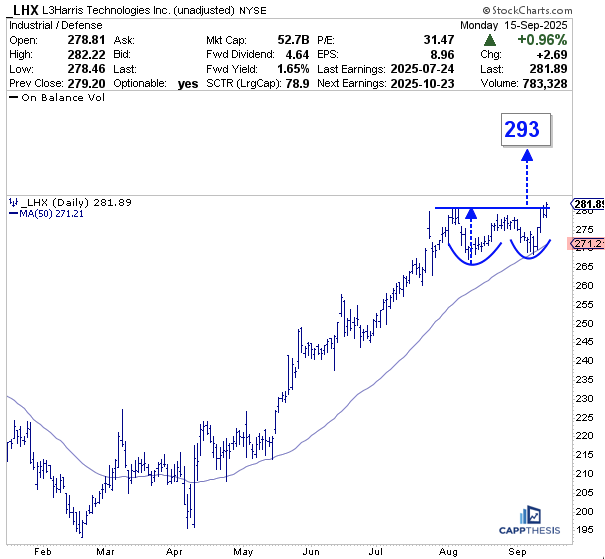
LHX L3Harris Technologies
Turning to individual stocks, one ITA component is LHX, which isn’t as widely known as some of the larger names. Not surprisingly, it has a pattern very similar to ITA — a high-level continuation setup that has been developing over the past several weeks.
This resembles a cup-and-handle formation, with the most recent advance occurring right at the 50-day moving average. A successful hold of this breakout would point to an upside target near 293.
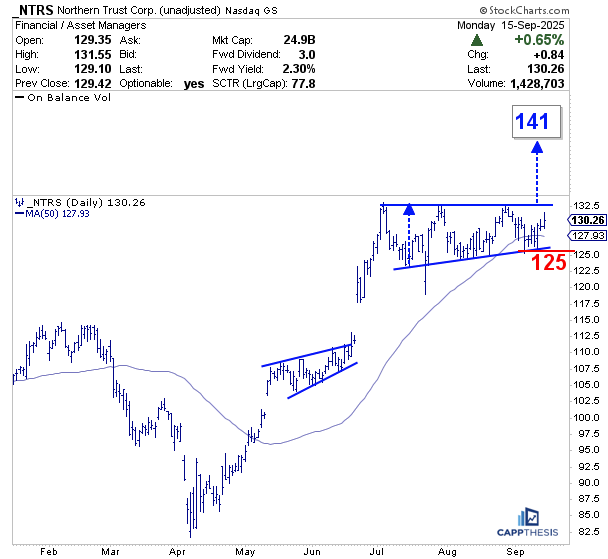
NTRS Northern Trust
NTRS has also formed a high-level continuation pattern over the past several months. The upside target from this setup points toward 141.
We saw a similar breakout in June, driven by a gap higher. Most importantly, after gaps like this, the key is whether the stock respects the light support zone to sustain the advance. In NTRS’s case, it did — and now it is trying to push back above the summer highs.
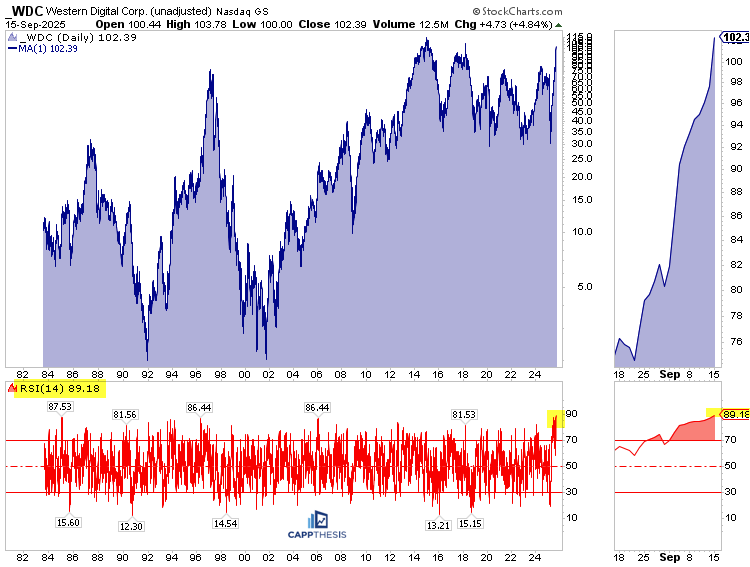
WDC
Lastly, here is a long-term (daily) chart of WDC. which is clearly extremely overbought. In fact, yesterday it finished with an RSI of 89, which is the highest in its entire. history.
Interestingly, despite that, it still isn’t at a new all-time high. Instead, it has rallied back to the near resistance levels that failed in 2013, 2017, 2020, and 2023. Needless to say, being this stretched at major resistance suggests that, at the very least, corrective action is due.
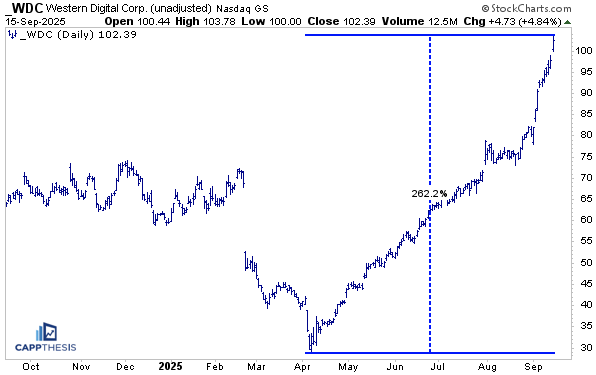
Looking more closely, the entire run that created this extreme overbought condition has totaled +260% from the April’25 lows.
While we haven’t seen many classical bullish patterns (such as a cup-and-handle or inverse head-and-shoulders), simply buying breakouts of the various small consolidations along the way and using a trailing stop would have kept traders in this stock up until now.
We don’t recommend buying into something that looks this extended, but it’s a clear example of how riding a trend is possible with the simplest strategy: employ a stop loss, which removes emotion and helps us stay in the game… while managing risk in case a larger pullback emerges.
A similar setup has existed in many other stocks — just not this extreme.
Excellent analysis, well presented.
One of the best technical drill down of the markets