


Happy Saturday. Below are five of the best charts from this past week, exactly as they were originally published… plus my latest StockCharts TV video, released last Wednesday.
Enjoy the rest of your long weekend.
Monday, 6/15
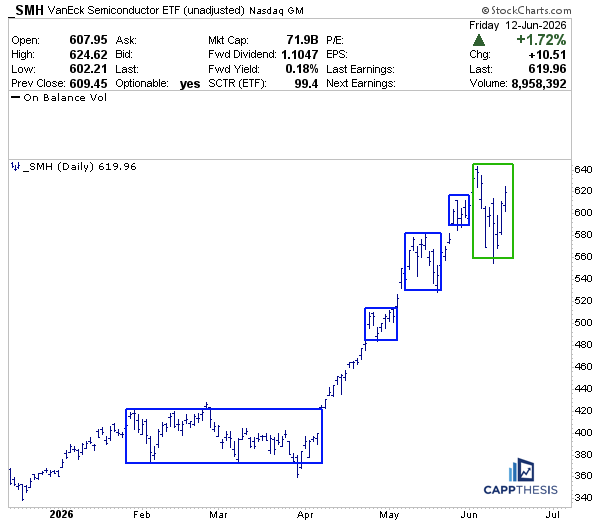
SMH Semis – Testing the edge of another trading box
With SMH trading considerably higher in the pre-market, it could soon be testing its former May highs. Having failed to completely break down during the recent pullback, it now has the opportunity to return to—and potentially break above—its latest trading box.
Indeed, this trading range is much larger in terms of height than the prior iterations. However, as we know, trading ranges come in all shapes, sizes, and durations. The key point is that when consolidation periods continue to resolve higher, the underlying uptrend can persist.
That principle is true regardless of the asset being analyzed, not just SMH. As long as consolidation leads to higher highs and higher lows, the trend remains intact.
Tuesday, 6/16
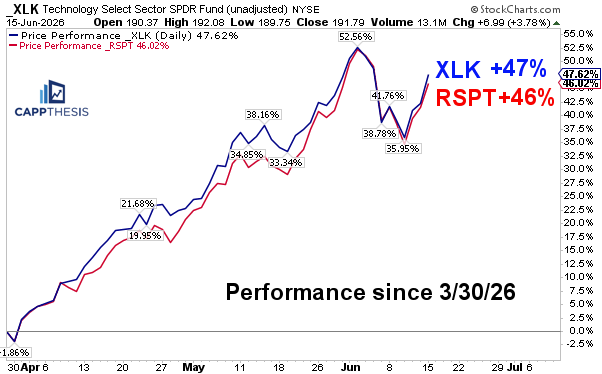
Tech dominating… beyond mega caps
As noted above, yesterday’s huge Technology advance wasn’t just about the biggest of the big tech names doing all the heavy lifting.
Indeed, the mega-caps performed extremely well and had a major influence on the S&P 500’s nearly 2% gain. However, 80% of the sector advanced, and on an equal-weight basis, RSPT performed nearly as well.
This wasn’t isolated to yesterday. As this performance chart clearly shows, RSPT has kept pace with XLK for the ENTIRE rally off the March lows. XLK is up 47%, while RSPT has gained 46%.
The strongest form of leadership within a sector occurs when the majority of stocks are moving in the same direction, nearly in unison. That’s exactly what has been happening in Technology. It is also a phenomenon we’ll be monitoring closely if/when divergences begin to emerge.
Tuesday, 6/16
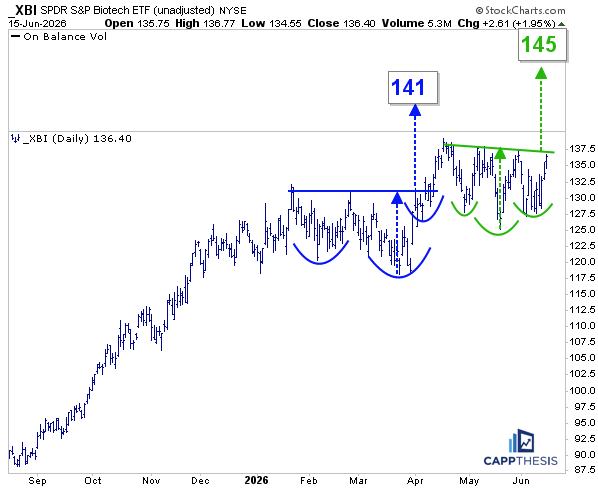
XBI Biotech – Another bullish setup
XBI is essentially flat since early April, but along the way it has constructed a clear potential inverse head-and-shoulders pattern (green), its second bullish formation of 2026. The first breakout occurred in April, but it was obviously short-lived.
Successfully leveraging this latest setup would help reignite the uptrend and potentially restore the positive momentum that faded after the prior breakout attempt.
Wednesday, 6/17
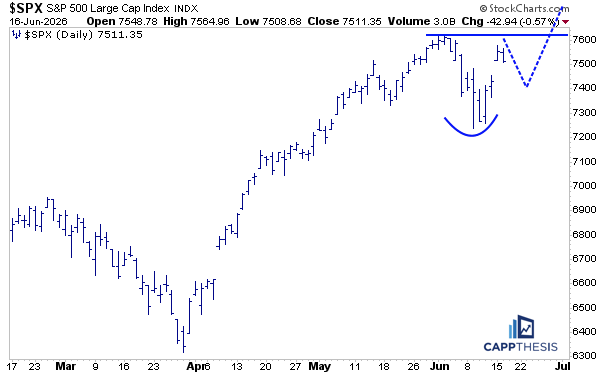
The SPX’s potential bullish pattern
The bullish pattern we’ve been profiling remains alive, as well. As noted yesterday, the only question now is whether the SPX will — or should — take another breather before attempting to push to new highs. Indeed, seeing a relatively shallow higher low materialize from here would be a constructive and potentially powerful next step before a breakout occurs.
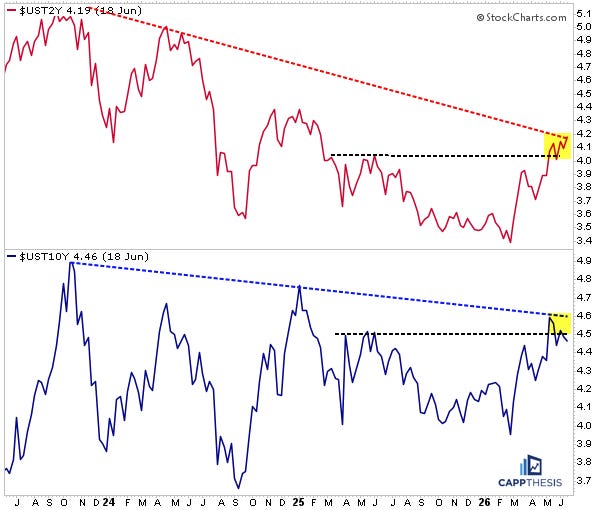
Thursday, 6/18
2 Year & 10 Year Yields
Treasury yields rose after yesterday’s hawkish tone and “new” language, with the 2-year yield hitting its highest point since early 2025. The 10-year yield remains below its recent peak. For now, though, both remain UNDER key downtrend lines.
CappNotes offers a small window into the work we do at CappThesis - a technical analysis newsletter company focused on classical chart patterns, trend, and risk management. Explore the full range of CappThesis services here: