


TGIF - This is an excerpt from the Market Section of today’s Opening Look.
For new subscribers, Opening Look is our daily pre-market note, in which we dissect the S&P 500, major indices, asset classes, ETFs and individual stocks. It’s categorized into four sections: Market, Statistics, Key ETFs and Chart Trades
Statistics – The first section analyzes daily market data such as new highs/lows, sector leaders & laggards, winning and losing streaks, how the market closes every day, S&P 500 vs. key moving averages and breadth. Seeing each one of these data points on the same table across multiple weeks reveals trends, sometimes before a shift is evident in the charts.
Market – The report’s second part is the meat of our market analysis. It includes studies, various S&P 500 charts, sentiment, breadth, indicators and a pattern tracker – a very helpful tool in determining our market stance.
Key ETFs – We showcase a handful of actionable charts from our 175 ETF universe in this section - potential breakouts/breakdowns, ETFs near important support/resistance zones and various other noteworthy set ups.
Chart Trades - Here we provide trade ideas based on individual stock charts. We categorize each idea so clients can easily understand the strategy. We also relay specific entry and exit levels, which presents a clear framework.
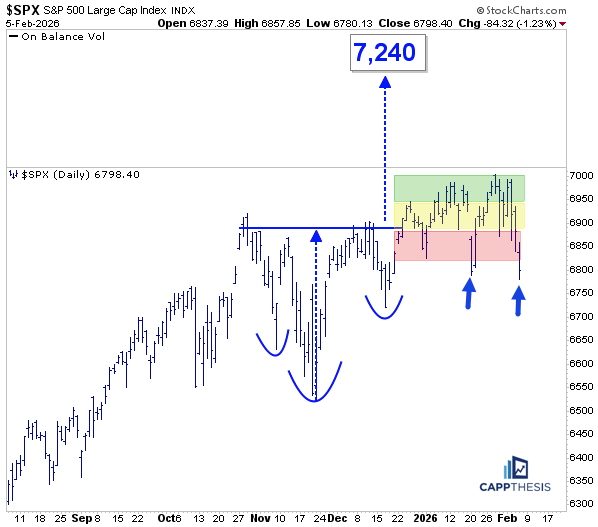
The bullish pattern is being tested every day
For the third straight day, the SPX slipped below the key 6,880 breakout zone, but this time failed to reclaim it and now sits about 1.2% below that level. Given how quickly the index rebounded from a similar sell-off two weeks ago, we’re giving it another chance and leaving the pattern on the grid for now. That said, another sharp down session without a rally attempt would officially negate the setup. Target: 7,240.
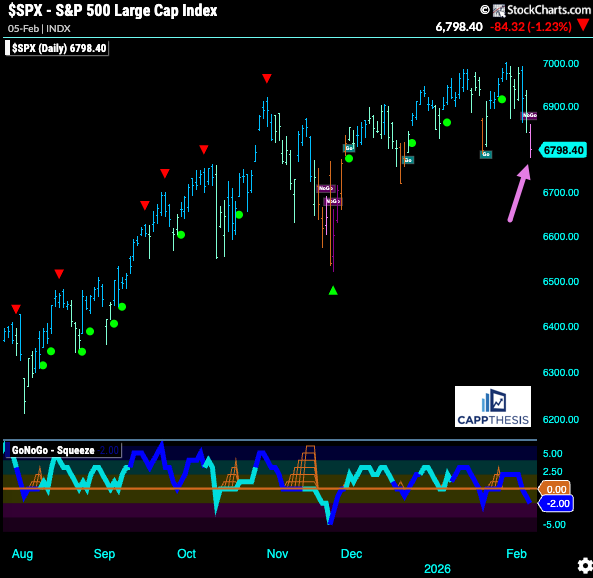
GoNoGo – Flipped to NoGo
The recent weakness—capped by yesterday’s full-day sell-off—was enough to flip the trend to NoGo. We’ve only seen three other NoGo bars since April 30, all occurring near the November ’25 lows, which ultimately proved to be false alarms as the market recovered quickly.
The key difference this time is that the trend flipped directly from Go to NoGo, skipping the Neutral (amber) phase that typically signals a transition before a trend change. While the reason isn’t entirely clear, it underscores how conditions had been weakening. Regardless, it’s all about the follow-through now….
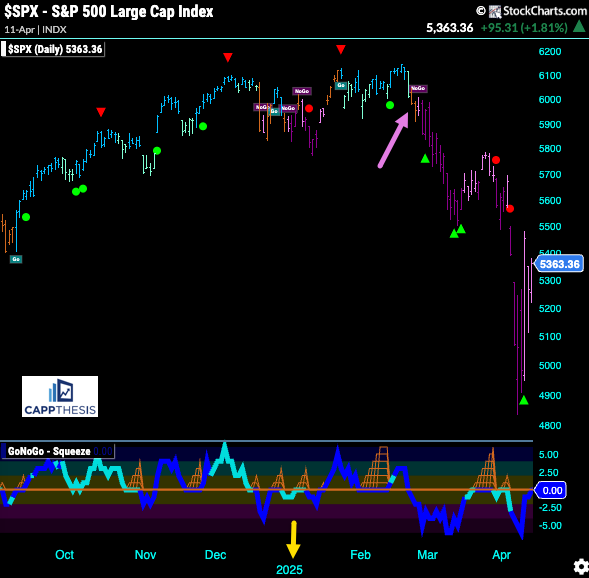
GoNoGo 2025 – How it played out
Similar to now, last year we first saw cracks in the GoNoGo chart in December ’24 / early January’25. The SPX recovered and made marginal new highs, but failed to leverage them. Within days of pulling back, the GoNoGo trend shifted from bullish to neutral, then turned bearish, where it remained through April.
In other words, no buying effort during the tariff-tantrum sell-off was strong enough to change the trend—underscoring how important it is now to see real buying interest this time.
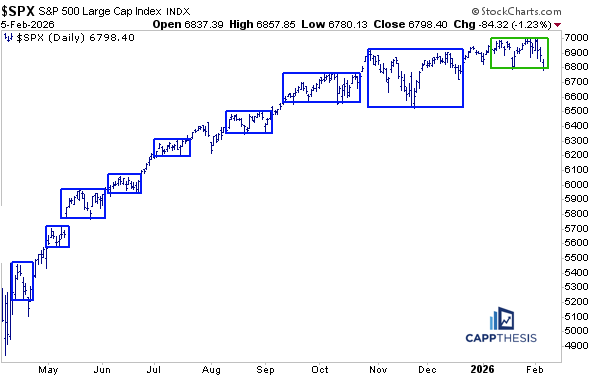
The Trading Box – Teetering
The SPX is sitting right on the bottom of the trading box we discussed yesterday—again highlighting how critical this level is from that perspective, as well.
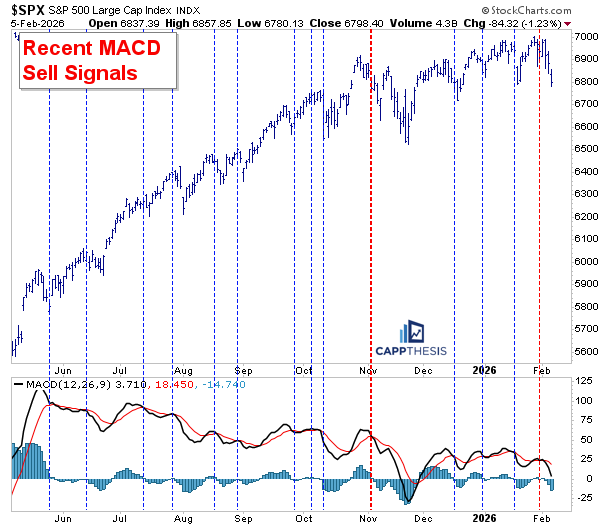
MACD – The latest sell signal
Not surprisingly, the recent pullback from the highs triggered the latest sell signal, which has been in play for a few days. While we’ve seen some initial follow-through—especially yesterday—it’s too early to call it successful.
Again, the onus remains on the bears to fully leverage this signal and meaningfully disrupt the market. Several areas have already been hit hard (software, crypto, metals), but with the majority of sectors still holding up, the SPX has yet to truly feel the full extent of that pressure.
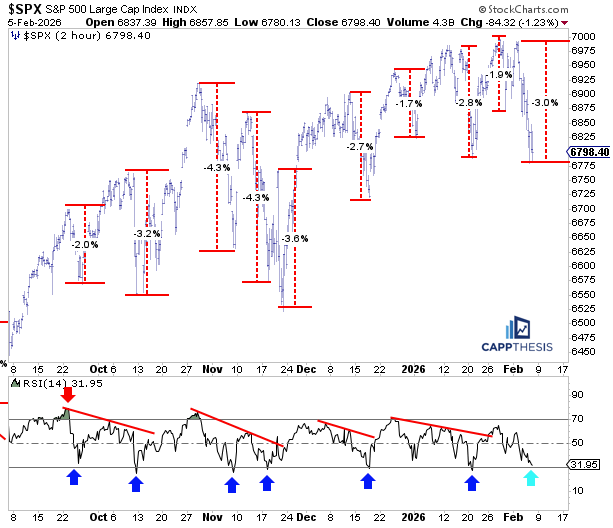
Short-term Drawdowns
The drawdown from the most recent bounce is now ~3%, the largest pullback since the three selloffs from Oct–November. This has pushed the 14-period RSI on the 2-hour chart to just shy of oversold.
As we’ve seen repeatedly, these short-term oversold conditions have led to the next rally each time over the past few months—if that doesn’t happen this time, it will be telling.
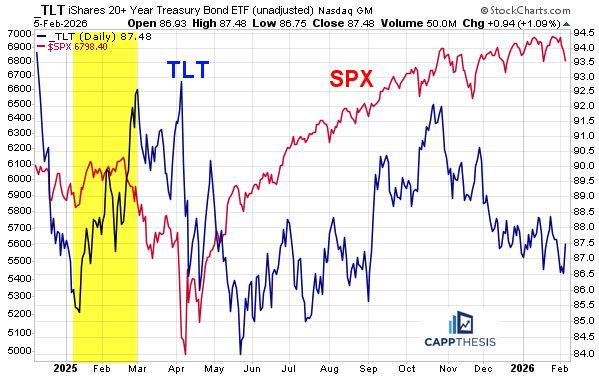
TLT & SPX
As noted above, the bond ETFs we track all advanced yesterday, implying that yields fell. Big picture, lower rates are typically a tailwind for equities. However, when volatility spikes and stocks sell off, bonds often act as safe havens, and broader narratives or correlations tend to take a back seat.
This hasn’t become a defining theme yet, but it’s worth monitoring bond behavior closely in case the equity weakness lasts more than a few days. A good reference point is last year, when we saw strong buying in TLT before and during the Tariff Tantrum as investors fled equities.
Then, beginning in late May, TLT resumed its rally in a more controlled fashion, which ultimately helped stocks stabilize. It’s about recognizing what type of trading environment we’re in first—the more chaotic it becomes, the less traditional relationships tend to matter.
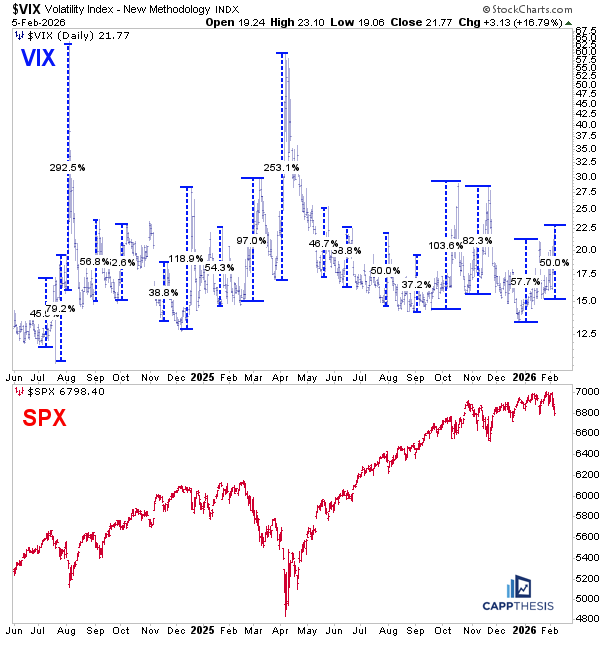
VIX & SPX
Checking in on the VIX, we recently discussed its tendency to see two major spikes, with the second often proving more powerful and damaging. The first move this time was about +57%, and the second is now ~+50%. While those are sizable, we’ve seen much larger spikes in recent years.
In other words, if today’s early gains aren’t leveraged, the VIX could push meaningfully higher, which would likely signal that non-growth sectors have finally given in to the broader tech and growth swoon.
CappNotes offers a small window into the work we do at CappThesis - a technical analysis newsletter company focused on classical chart patterns, trend, and risk management. Explore the full range of CappThesis services here: