


Today, we’re comparing this 2025 comeback attempt to another recent stretch of similar action today — but first, let’s start with the SPX’s death cross.
Death Cross
As we all know by now, the SPX’s 50-day moving average closed below the 200-day moving average yesterday, creating the notorious death cross.
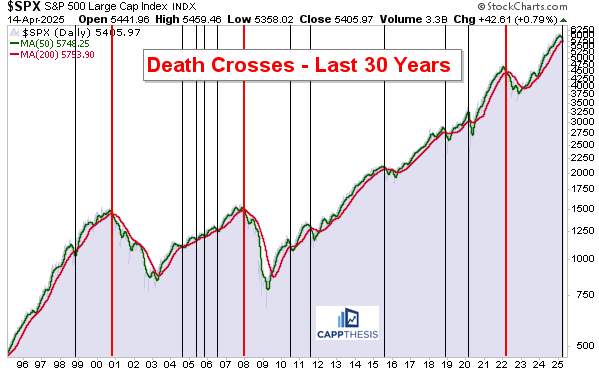
The bottom line: As you can see from the 30-year chart below, we’ve seen four different outcomes after this signal:
Death crosses during long-term uptrends.
This scenario typically leads to a relatively short-term decline, which dip buyers quickly take advantage of—eventually pushing the 50-day back above the 200-day as the uptrend persists. This was most evident from 2004 through 2006, shown by the cluster of black lines on the chart.
2. More downside that’s relatively contained.
We saw this play out in 2011 and 2015–2016. The market pulled back and endured periods of back-and-forth movement but didn’t break down meaningfully.
3. Key trading lows soon followed.
The death cross also led to major bottoms soon after happening, like the end of 2018 and, of course, March 2020 (COVID crash).
4. And finally—the worst-case scenario: a prelude to major downside.
That’s what happened in October 2000, late 2007, and most recently, March 2022.
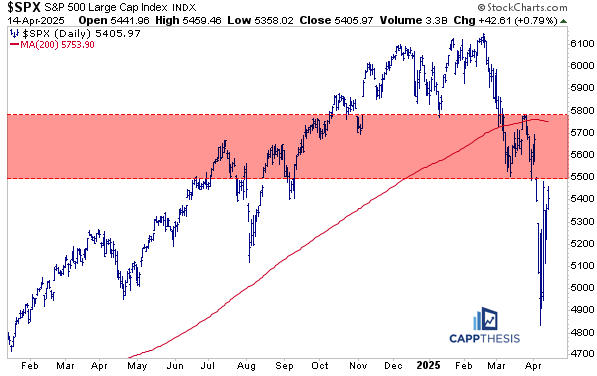
SPX 5,500
So, the question is: Which result will 2025 bring? Time will tell, but with the market having experience a huge spike from the lows, all eyes will be on the response to the next true pullback. And with the SPX getting close to that well-known resistance area around 5500, that test could happen soon.
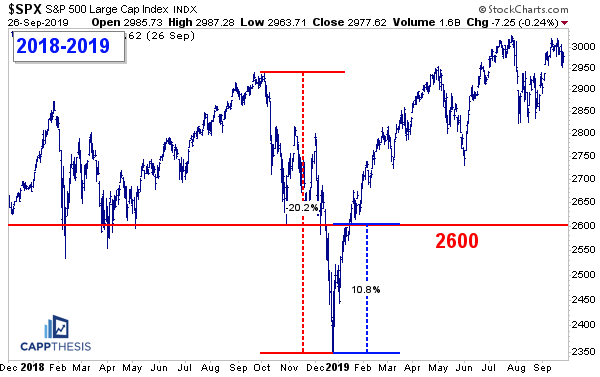
2018-2019
That death cross in 2018 occurred in the first half of December, and the SPX got hit hard in the ensuing weeks right up until that big +5% reversal on 12/26. That comeback carried through January and extended for months afterward.
But it wasn’t so easy to navigate in real time. The index had just dropped more than 20% in under three months—the second major drawdown of the year (after the volatility implosion in February)—completely derailing the prior persistent rally to new highs.
So, when the sharp bounce brought the SPX back to the 2,600 zone by early February, most traders saw it as a natural spot to take profits or reinitiate shorts. Instead… the torrid pace continued up until May, as the SPX finally paused after getting all the way back to its former all-time highs.
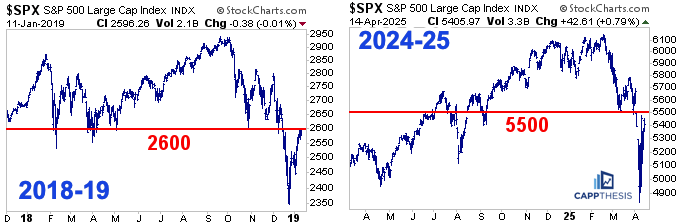
It’s very similar to the current setup—with the SPX now eyeing the 5,500 zone after a 20% “crash” and a 13% snapback off the lows.
So… let’s keep this blueprint in the back of our minds… just in case the next few weeks or months go better than most expect.
Great post Frank. And you're right: with the market have made a huge bounce, it's now at a decision-making point!