


Happy Sunday. I wanted to share the Market and Key Charts sections of Friday morning’s Opening Look. With the half day of trading and minimal net-movement, the commentary and charts remain quite relevant heading into December.
Live Patterns
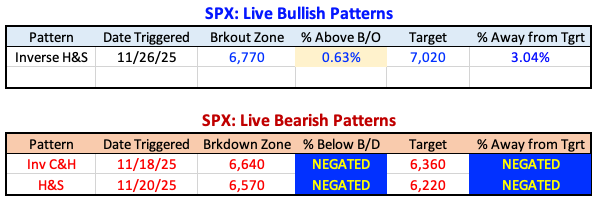
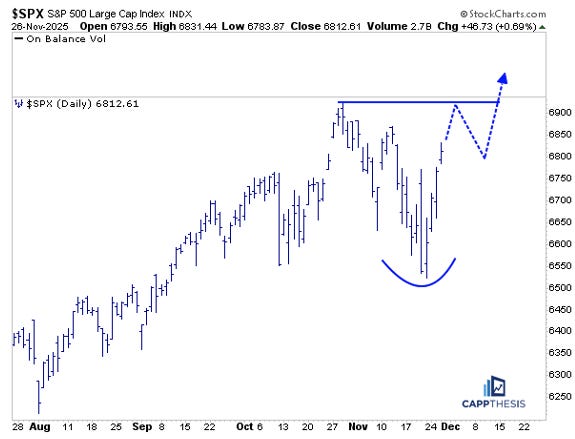
The continued advance has now triggered a bullish pattern best seen on the short-term 60-minute chart. The move has been fairly relentless, as we know, but a brief pause a few days ago was enough to form a small right shoulder of this inverse head-and-shoulders pattern.
Holding above the 6,770 area would keep this breakout intact, with a clear upside target near 7,020 — which would mark new all-time highs. The SPX can pull back about 60 basis points at this stage and still maintain the pattern.
Even though this is a short-term, relatively small formation, it carries a meaningful upside measured move. More importantly, watching how well the market digests this near-term strength will be important, because if it holds, the larger potential pattern we’ve been tracking may also have a chance to trigger.

Potential Patterns
The bounce back has, of course, helped pull the S&P move closer to turning the potential bullish formation into reality. There’s still work to do, obviously, and we’ll continue to update this potential blueprint as it develops.
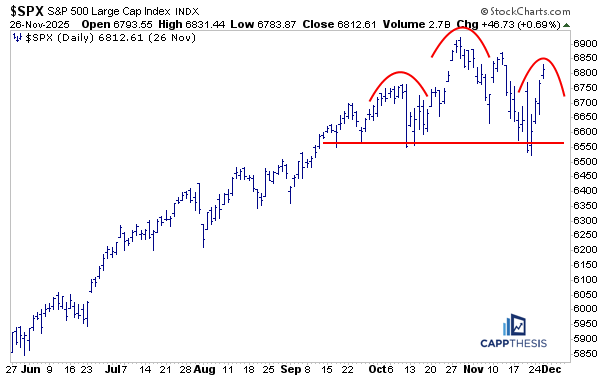
We can’t completely disregard the possibility of another wave of selling returning either. If that were to happen soon, a different version of the bearish pattern we were tracking last week could still play out — just with a slightly different-looking right shoulder.
Regardless, we’ll keep it on our radar.
After Heightened Two-Way Volatility
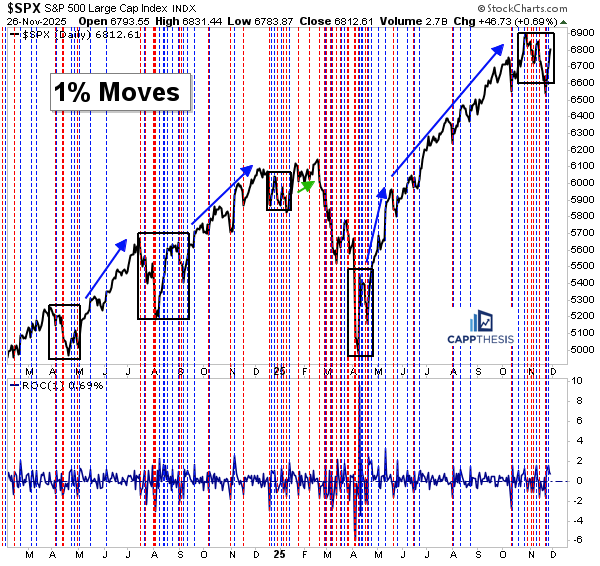
Going back to October 10, the S&P 500 has now logged twelve 1% absolute moves. After the recent snapback, we’ve had six gains and six losses, and—even more telling—we’re sitting right around the same levels we were at just before the initial 2.7% decline that kicked off this period of heightened volatility.
During this stretch, the S&P has endured its largest pullback (~6%) since the spring, and given that it has now bounced back with one of its best 4-day runs of the year, it’s fair to say the market has done a good job digesting that bout of selling.
What’s next? If we continue to see frequent 1% swings, it likely means those moves will appear on both sides of the tape — up and down — which would keep the trading environment challenging. Big moves = whipsaws = messy breakout attempts. That will be the biggest challenge in the weeks ahead.
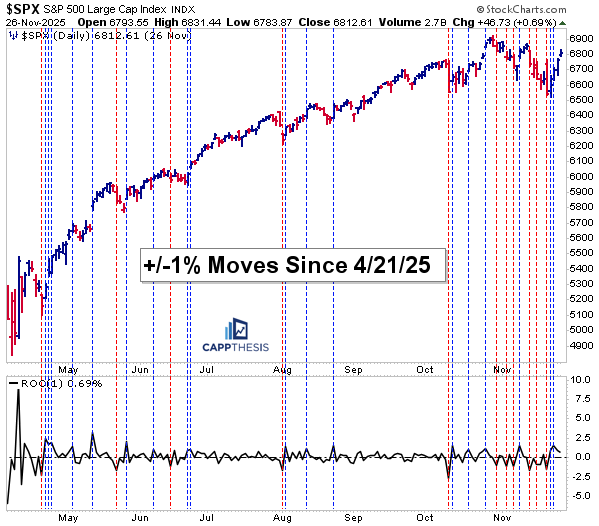
The positive takeaway here is that this recent consolidation — though volatile — can still follow through and potentially turn into another breakout to new all-time highs. If that happens, the market could shift back into a calmer, more persistent uptrend.
This chart remains one of my favorites because it captures each of the digestion periods (and ensuing breakouts) going back to spring 2024. Each box also highlights a phase of cooling off near the highs, where the S&P paused, held key levels, and eventually broke out of its trading range.
Historically, when these breakouts occurred, they often led to:
Trend extension,
Lower volatility, and
A higher probability that subsequent breakouts would follow through.
And that blueprint — digest, break out, then extend — remains the most constructive roadmap for the remainder of the year.
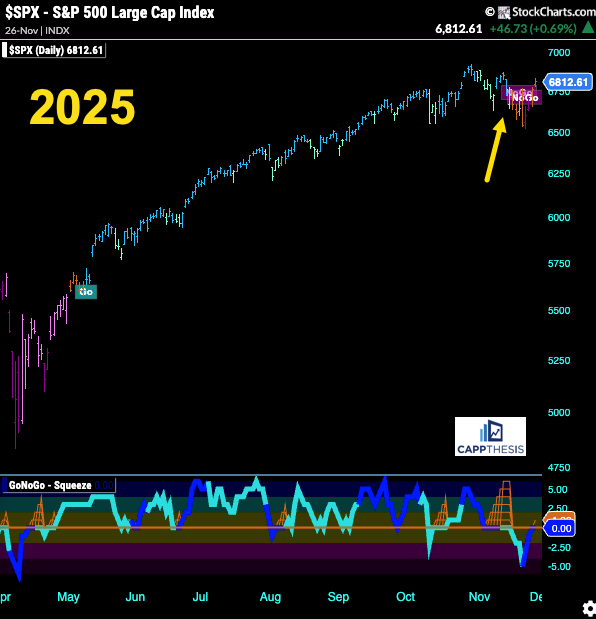
GoNoGo Trend – Daily
The GoNoGo Trend remains neutral (amber) even after the continued comeback, as we can see in the chart. As noted on Wednesday, continued strong movement could flip this back to bullish. Given that it took a 6% decline to shift the trend from solidly bullish, this is understandable.
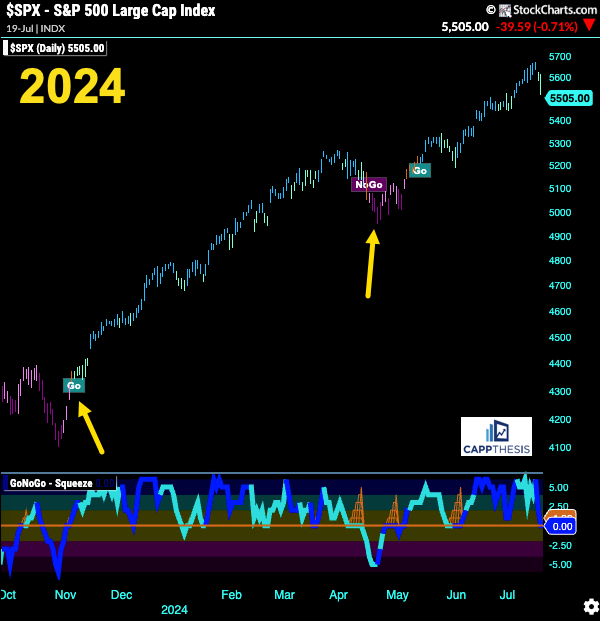
As noted earlier this week, the period worth comparing this to is the spring pullback of 2024. That decline occurred roughly five months after the market bottomed in late 2023.
The GoNoGo Trend remained consistently bullish up until the beginning of April, when it flipped bearish — but the market quickly found a bottom and regained bullish status relatively soon after.
It’s a very similar setup now.
In both cases, the S&P 500 was down about 6% peak-to-trough:
March–April 2024, and
October–November 2025 (with last Friday marking the recent low).
This alignment suggests the current environment may be mirroring that spring 2024 pullback, where a short-lived correction gave way to a renewed uptrend.
CPER Copper
CPER gained about 2% on Wednesday, putting it among the market’s leaders. It is now getting very close to challenging its most recent resistance zone near 32.
As we know, copper has seen extreme back-and-forth movement tied to tariff headlines going back to April. But between those headline-driven swings, it has shown a consistent ability to form and complete bullish patterns.
In fact, copper has already leveraged two prior consolidation periods, breaking out cleanly and hitting upside targets both times. If this pattern repeats, there is a clear path for CPER to do the same again now. And if that plays out, the next measured move would point to a target up near 34.

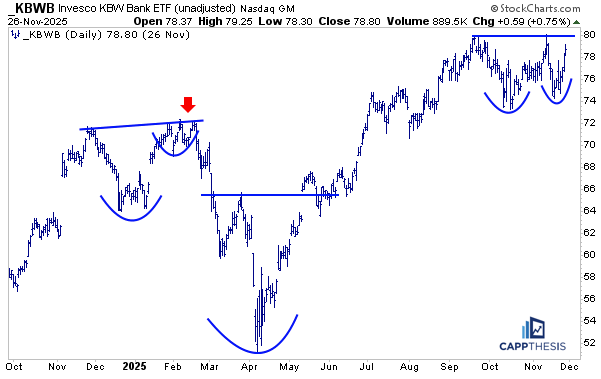
KBWB Banks
KBWB continues to rebound, and we previously discussed the potential for a bullish pattern to form the last time it hit 80 in October. The idea was that a higher low from that point could help digest the prior run and set up a constructive pattern to leverage.
That scenario has essentially played out — though the pullback was deeper than we expected. Now that price has returned to the key resistance area, we can see that another bullish pattern is close to being completed once again.
Bitcoin
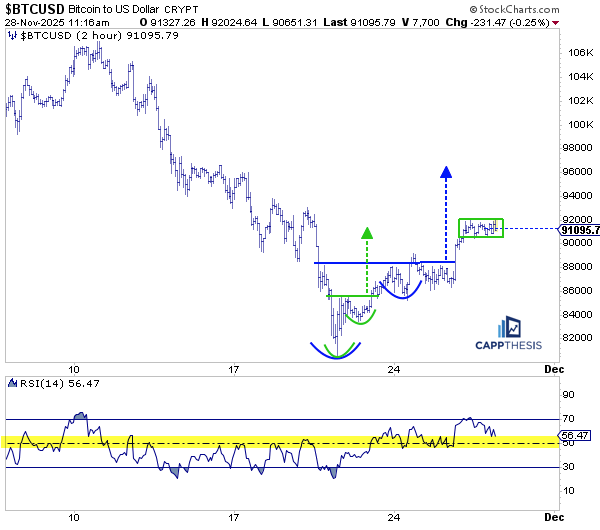
I’ve been tracking Bitcoin’s comeback on the two-hour chart using the same framework we apply to the S&P 500—evaluating bullish pattern development, monitoring the 14-period RSI, and reviewing momentum off the reversal pivot low from last weekend.
Thus far, BTC has leveraged the small cup-and-handle pattern (in green), successfully achieving its modest upside target just above 91k.
On top of that, we now have another cup-and-handle pattern forming (in blue), pointing toward a secondary measured-move target above 96k.
The most constructive aspect of this breakout from a few days ago is that Bitcoin has been able to consolidate above the 90k zone, forming what could be either tight trading box or a bullish flag pattern. Either way, the ability to base at these elevated levels supports the continuation of the comeback narrative.
From a short-term momentum standpoint, the 14-period RSI on the two-hour chart pushed into overbought territory this week for the first time since November 10, which marks another step in the right direction.
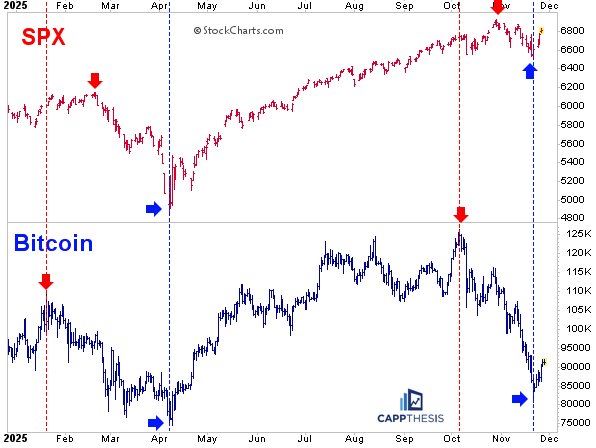
Even if one doesn’t trade Bitcoin directly, we all have to pay close attention to it because it has led both major S&P 500 pullbacks this year. As we’ve discussed before, Bitcoin peaked in mid-January, a few weeks before the S&P 500 rolled over. It then topped again in early October, roughly two weeks ahead of the S&P’s peak this time.
The bottoming behavior has been more synchronized: both Bitcoin and the S&P 500 turned higher around the same time in April, and again in November so far.
Thus, watching how both markets behave during this current rebound phase will be important, particularly if Bitcoin continues to act as a leading indicator for equity risk appetite.
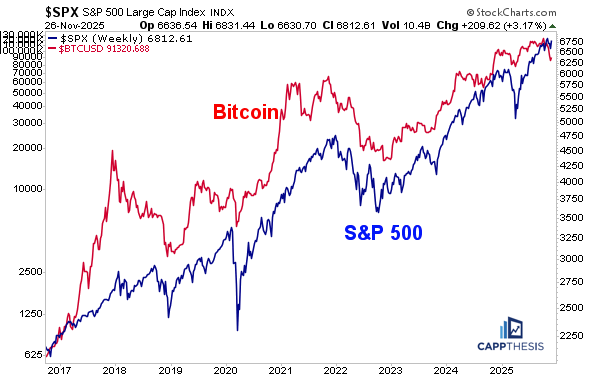
And as we know, Bitcoin and the S&P 500 have been positively correlated since Bitcoin’s inception, with only brief periods where they move in opposite directions. They rarely diverge for long.
The GoNoGo indicator has been in the “NoGo Bearish” phase since the middle of October, and so far, this rebound hasn’t done anything to change that. This remains an important signal to watch, especially if price continues to recover while the indicator stays defensive.
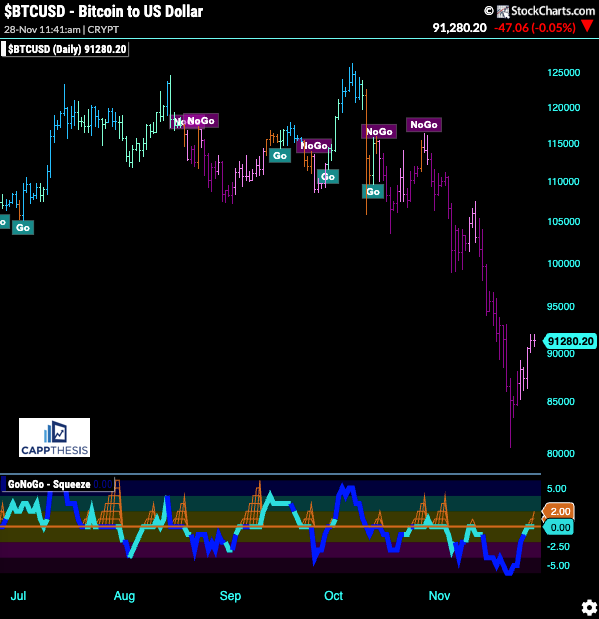
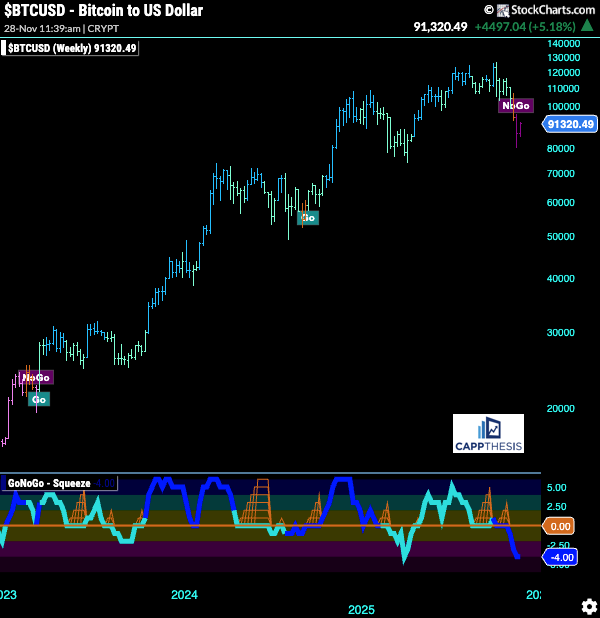
The bigger concern, as we’ve discussed recently, is that the weekly GoNoGo indicator flipped to a bearish reading over the past two weeks—its first bearish shift since early 2023.
Bitcoin needs more time and a stronger rebound effort to turn this into a simple whipsaw. Otherwise, the risk remains that rallies like the one we’ve just seen could be sold into again.
We should get a much clearer read on how durable this rebound attempt is very soon.
Today’s Chart Trade idea is a popular name that is close to breaking out after a period of constructive consolidation…