Good morning,
Today we’re sharing this morning’s full length, unlocked, Opening Look note.
Please also check out:
My CNBC appearance yesterday:
And Last evening’s YouTube Video:
Key Points
The S&P logged its worst decline since August 1 on September’s first day. However, it could have been much worse—an intraday bid appeared around 11:30, cutting the decline in half and allowing the index to finish at the very top of its trading range.
This produced a hammer candlestick pattern, something we’ve seen before this summer. We’ll discuss this, along with an update on the short-term work, a look at the MACD indicator, several other S&P 500 charts and ETFs, and the first trade idea of September.
Last Five Trading Days
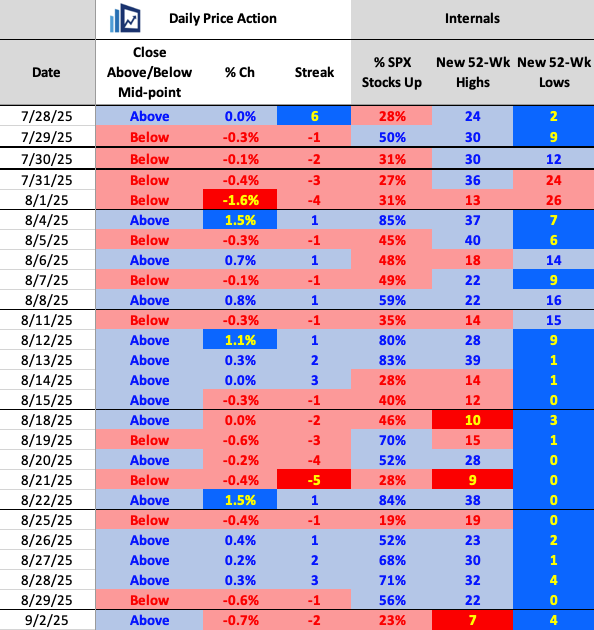
Daily Price Action
On the positive side, yesterday once again we saw another mid-day bid—demand surfaced and allowed for a strong close. It wasn’t enough to flip the tape: internals remained weak, with just 23% of S&P 500 stocks advancing…
That number doesn’t tell the full story, though. Most stocks finished much closer to their intra-day highs than their lows, a constructive sign. What we need now is follow-through.
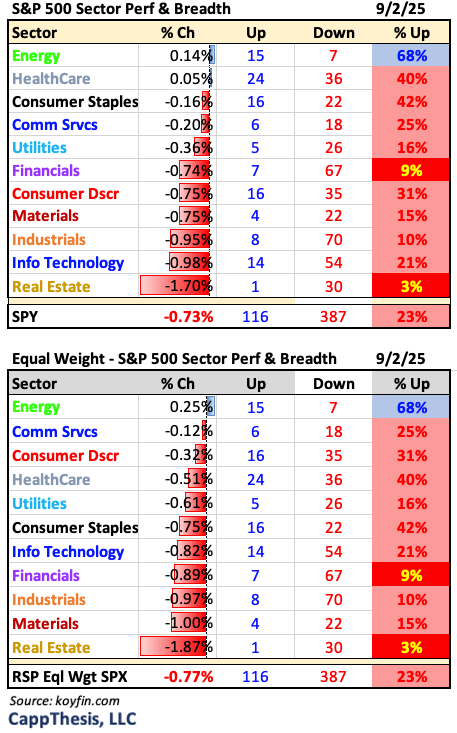
Sectors
Only Energy managed to show positive breadth, with nearly 70% of its holdings advancing on the day. On the downside, Financials and Real Estate both had less than 10% of stocks finish higher. Meanwhile, Healthcare stood out again, with its relative strength from August carrying into September’s first session.
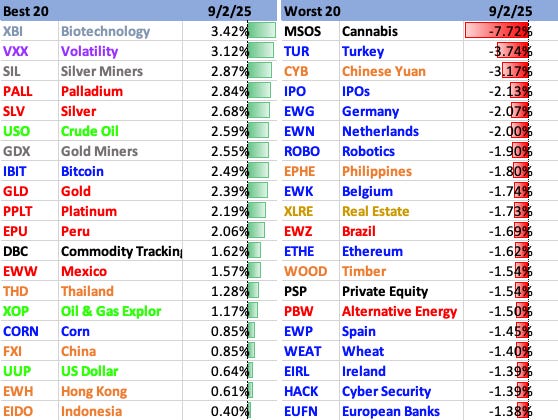
Best & Worst 20 ETFs
Biotech stood out yesterday, with XBI gaining over 3% and closing at its highest level since February 21. The ETF has now retraced 100% of the decline from that point and continues to show strong technicals.
Precious metals and miners also continued to perform well, alongside Energy and Asia-related indices. On the downside, Cannabis stocks finally took a hit, joined by many European ETFs.
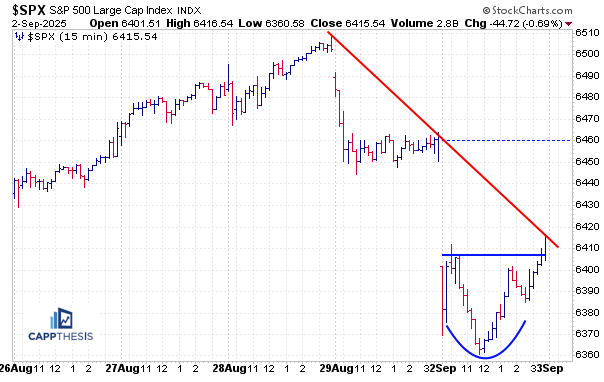
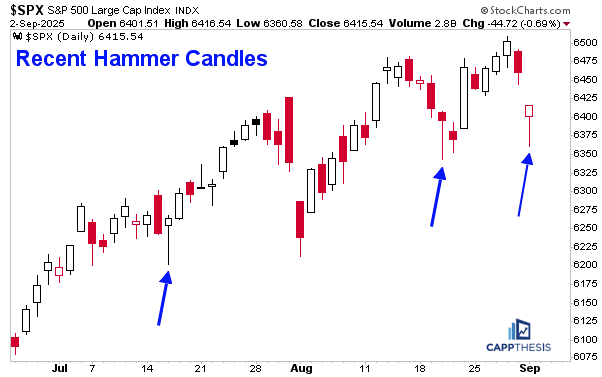
Another Hammer
By the S&P 500 rallying strongly intra-day and finishing near the very top of its range, it logged another hammer candlestick. While these don’t always result in a daily gain (like yesterday), they signify bullish trading and a close near the top of the intraday range.
We’ve seen these before. The last two instances coincided with trading lows in mid-July and mid-August. For this one to carry weight, we’ll need to see upside follow-through, as we did in those cases. That said, it doesn’t have to happen right away.
Recall that in August, the hammer appeared during what became a five-day losing streak—but even then, the dip proved to be just a natural pullback within the broader five-month advance. Buyers quickly returned, pushing the index to new highs.
As we know, dips routinely have been met with buying in the days that follow since April. If that pattern fails here, it will mark a change of character—something we’ve been watching for. But for now, the uptrend persists.
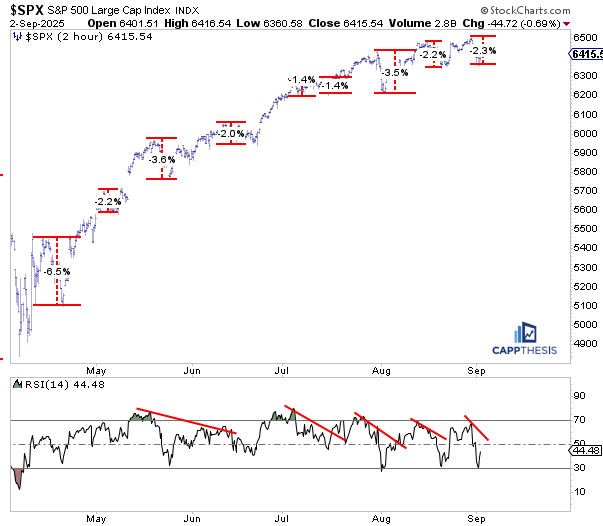
Short-term Declines
Turning to the short-term work, the most recent decline totaled about 2.3%—once again a very small pullback. Still, it was big enough to push the market into another short-term oversold condition.
We’ve seen this setup before—twice in August: once at the very beginning of the month, and again just two weeks ago. In both cases, the decline stopped soon after the 14-period RSI on the 2-hour chart dipped near 30. As we know, buying pressure typically surfaced after that.
The demand wasn’t overwhelming—resulting in the S&P only making marginal new highs twice—but it was enough to prevent a larger decline.
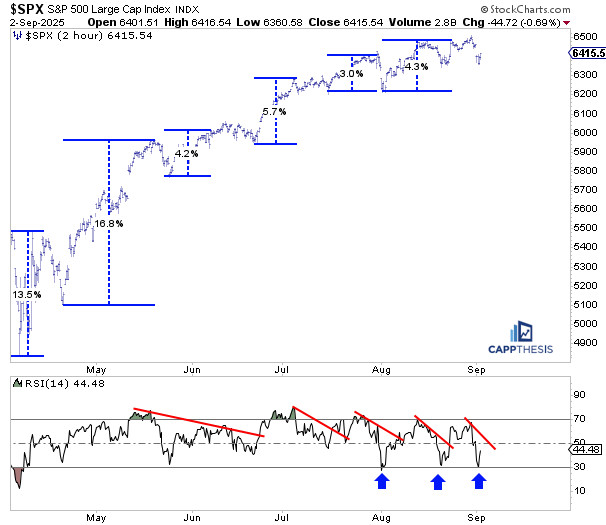
Short-term Rallies
From a rally perspective, another round of demand could easily pull the S&P 500 higher and into new highs—a scenario we’ve seen repeatedly over the past few months.
One thing to note: the last bounce, while it did produce a slight new high, did not generate a short-term overbought reading. If the same thing happens again this time, it will provide a small but potentially revealing clue that momentum is fading.
This will be important to monitor over the next week and a half, particularly as we approach the FOMC meeting (9/16-9/17).
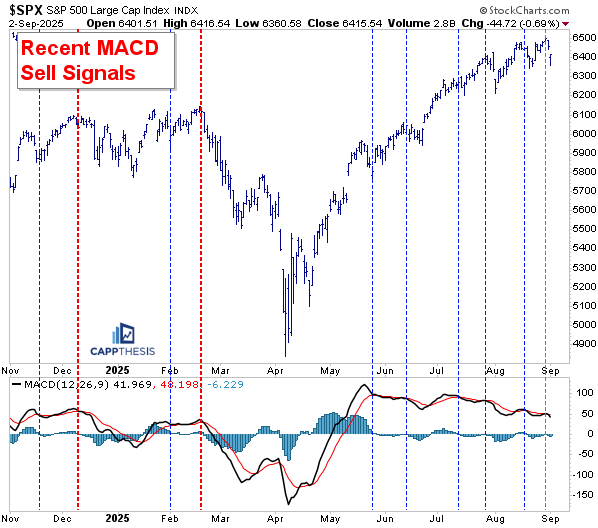
MACD Sell Signals
Another gauge we continue to lean on for identifying a potential character change is the MACD indicator. We once again received a sell signal a few days ago as the S&P pulled back from its highs. This marks the sixth MACD sell signal since May.
As we know, none of these have produced a meaningful decline—only small dips tied to slowing momentum, which then caused whipsaws in the indicator. At some point, this will change, and a full-fledged selloff will follow a MACD turn. But until that happens, we have to respect the fact that the uptrend continues.
The takeaway: mean-reverting indicators like MACD should not be followed blindly—the last few months have provided very clear evidence of that. But when they repeatedly fail, it tells us demand continues to be present.
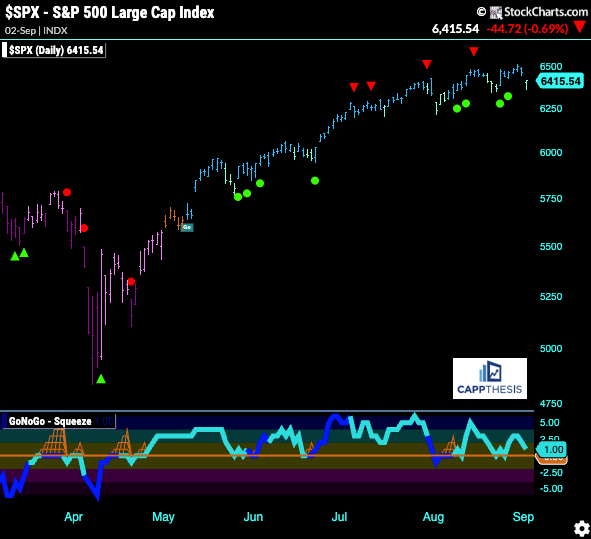
GoNoGo Trend – Daily
The GoNoGo indicator remains in a bullish trend.
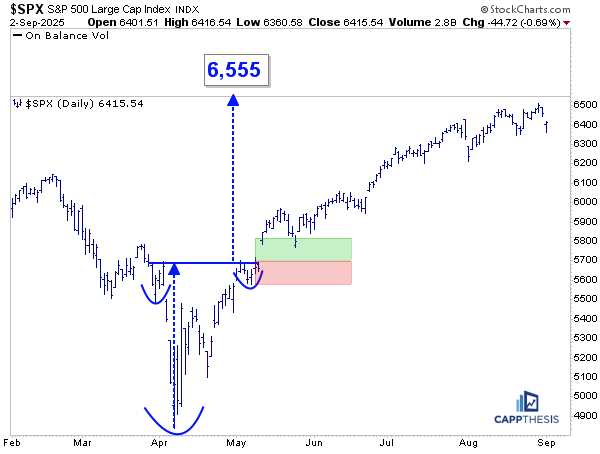
Live Patterns
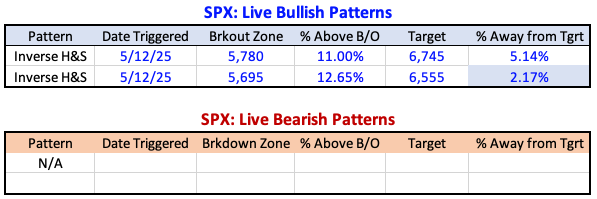
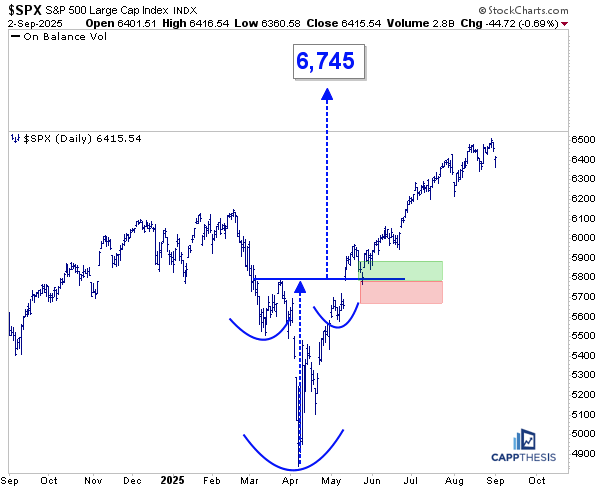
The two big bullish pattern breakouts remain in place, with targets of 6,555 and 6,745.
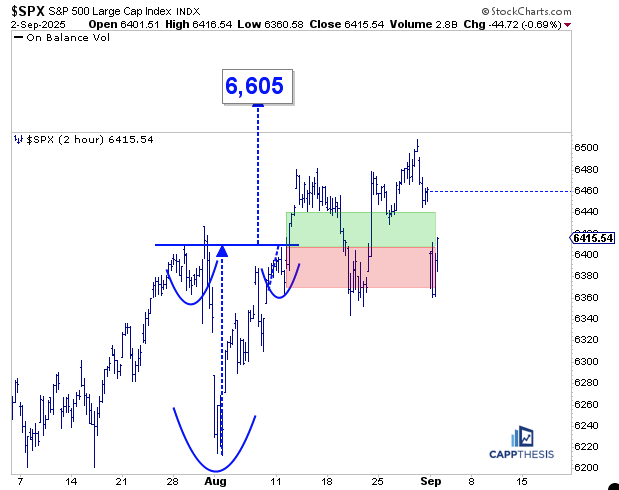
However, the breakout from August 12 has now been taken off our pattern grid. While the S&P did close back above the breakout zone at 6,410 yesterday, the last three weeks have been a messy back-and-forth range.
On a short-term, intraday basis, this just can’t be called a successful breakout. While the index may, indeed, hit the 6,605-target, the repeated violations of the breakout zone mean the pattern itself is no longer valid.
The hope is that all this choppy action will eventually set up the next bullish pattern, which would allow the trend to continue.
Bearish Patterns
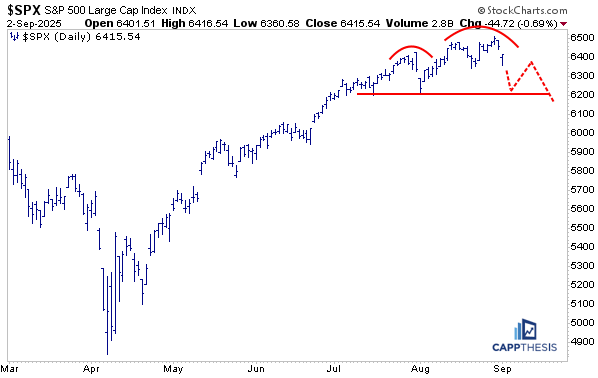
Turning to the potential bearish pattern we’ve been tracking—it still remains a possibility. Even though we saw another new high last week, it was only marginal. That high could still serve as the “head” of a potential head-and-shoulders pattern.
For this setup to play out in its current form, we would need to see:
1-More downside action,
2-A subsequent lower high, and
3-Ultimately, a breakdown.
We’ve been watching for patterns like this for quite some time, but so far, none have confirmed.
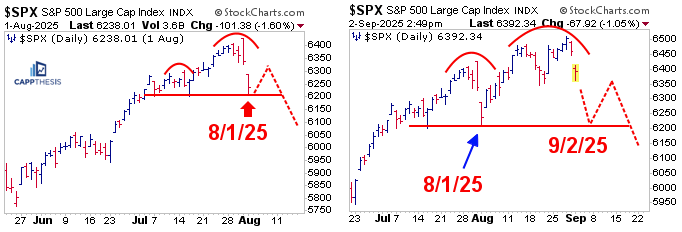
As we know, the last time we saw a failed bearish pattern was in early August, when it looked like the S&P might be rolling over. Instead, there was no downside follow-through—and the setup quickly turned into another buy-the-dip opportunity, which the S&P once again took advantage of.
That failure has now given rise to the next bearish pattern. But as we often say, failed bearish patterns are just continuation formations within the prevailing uptrend.
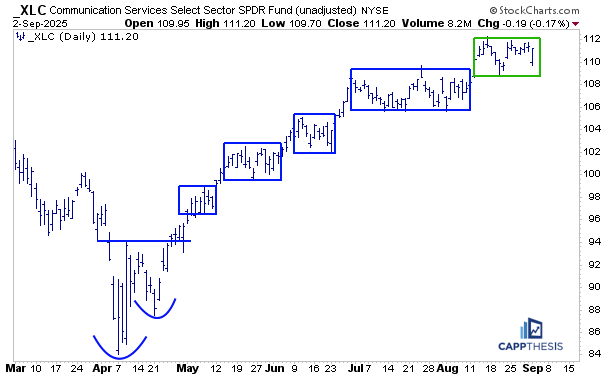
XLC Communication Services
XLC is trading higher this morning on news and could be on the verge of a new all-time high. This continues the very consistent uptrend in place since April, when a cup-and-handle breakout triggered further upside follow-through.
While the advance hasn’t been emphatic at every step, the entire move can be viewed as a series of trading box breakouts. We’ve now seen four of these breakouts so far, with a potential fifth forming now.
As long as this pattern continues to play out, the bias remains firmly on the side of the uptrend.
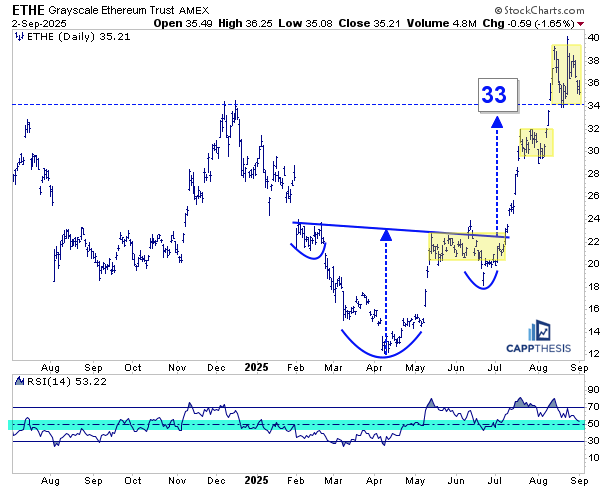
ETHE Ethereum
As we know, crypto has had a wild run recently. Ethereum, despite the volatile back-and-forth moves, continues to respect the 3400 zone—a positive sign, especially after achieving its upside target of 3300 on the way up.
This could mark the third continuation pattern since the April lows. Even though the RSI has overheated at times, it has not broken much below 50, which has helped maintain the broader uptrend.
As long as that remains the case, there’s good reason for demand to return on dips, supporting the trend higher.
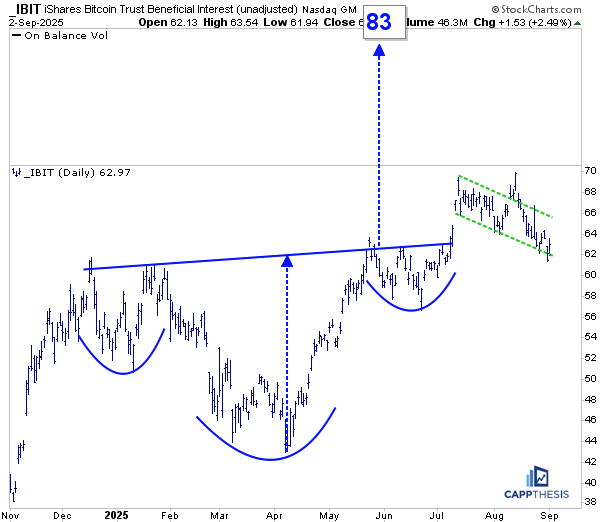
IBIT Bitcoin
Looking at the Bitcoin ETF, the first chart shows that even after pulling back following its breakout, the ETF has so far respected the 62- breakout zone. As long as that level holds, the 83 target remains achievable—though it may take time for that to play out.
For that scenario to unfold, we’ll need to see bullish continuation patterns develop. Whether we label this a flag, wedge, or another consolidation, the sideways movement acts as a pause that refreshes demand, setting the stage for another potential leg higher.
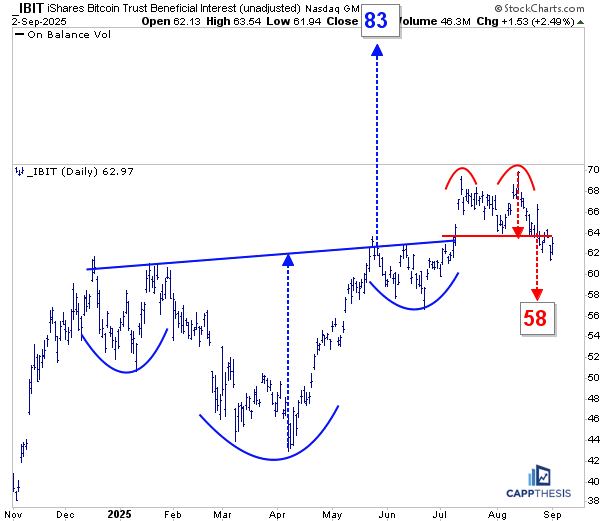
Another way to view the last two months of action is as a topping formation. If price stays below the 64 area, that could open the door to a move down toward 58.
If that doesn’t play out, however, this could instead become a failed bearish pattern—essentially a bear trap, which also would be bullish and reignite buyer interest.
GDX Gold Miners
GDX has been on fire. Over the last two days, it achieved two important pattern targets we’ve been tracking.
The first was a bullish flag formation on the daily chart, marking yet another successful bullish pattern—the fourth since February.
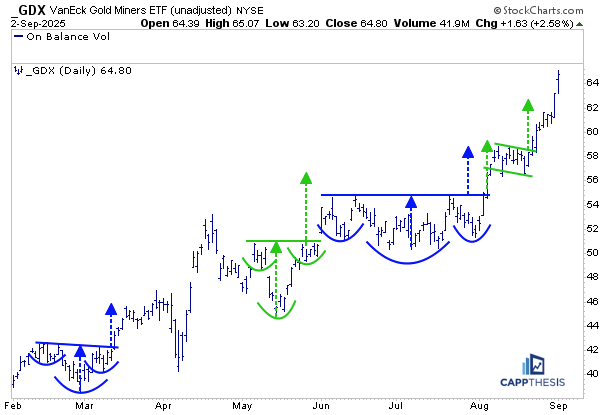
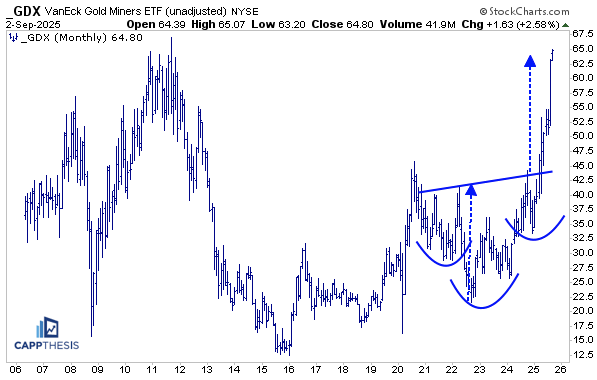
That wasn’t the only target that got hit. There was also the huge monthly inverse head-and-shoulders breakout that took place earlier this year, which was quickly achieved over the following months. Again, this move was made possible by the series of smaller bullish patterns that worked out along the way.
With GDX now extended and nearing its prior all-time highs, there’s good reason to expect a short-term pause or consolidation.
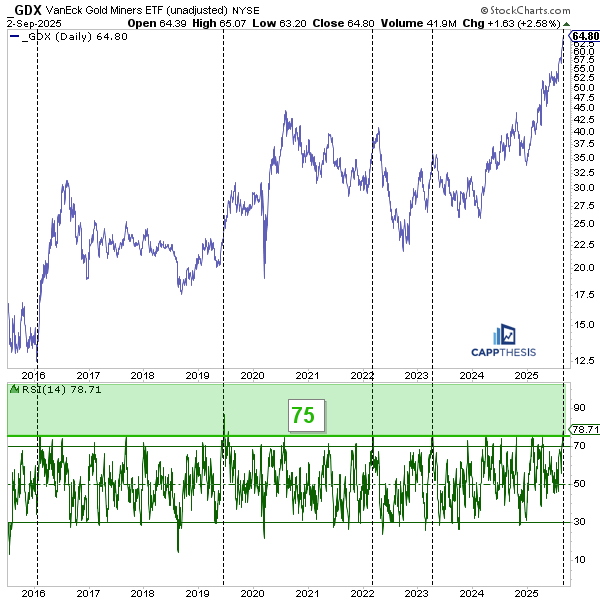
In fact, GDX closed yesterday with an RSI reading just below 79—the second-highest level since 2016, with the only higher level occurring in 2019. Looking back, there have been only a handful of instances in the last decade when the RSI reached at least 75.
In 2022 and 2023, those spikes led to immediate pullbacks. But in 2019 and 2016, GDX still had more upside to go before consolidating.
This context suggests that while near-term risks of a pause are elevated, history shows that overbought doesn’t always mean “finished.”
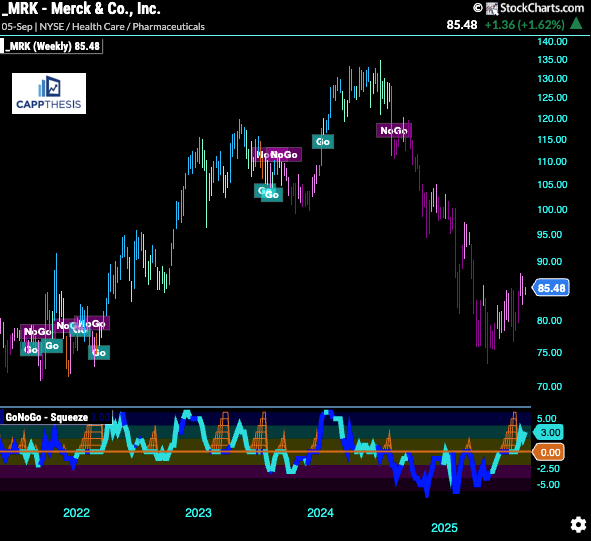
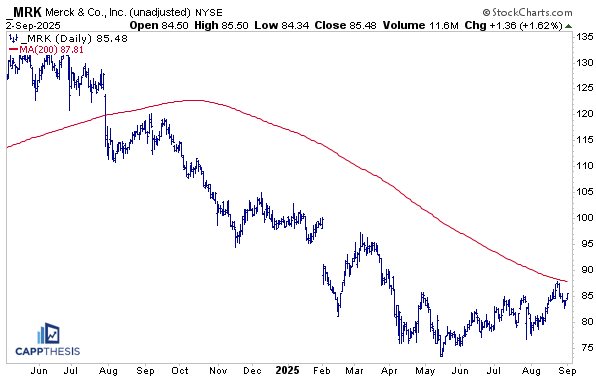
MRK Merck
Merck (MRK) has been flat since early April, making it a serious relative underperformer over that stretch. Along the way, though, it has built a base that resembles an inverse head-and-shoulders pattern.
We saw an initial test of this pattern in late August, and after yesterday’s strong move, it could be on the verge of triggering a breakout. If confirmed, the pattern would project to a price target near 97.5, which roughly lines up with the former March high.
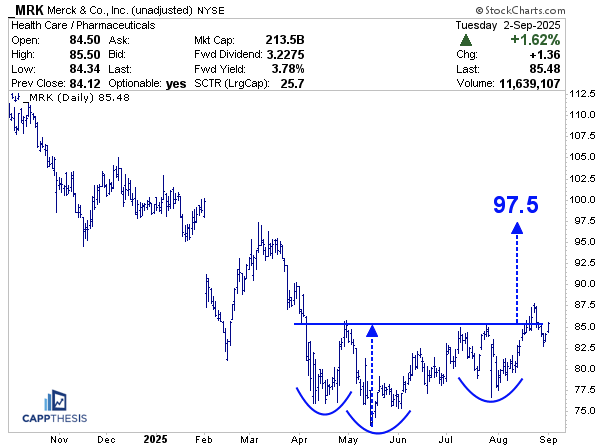
That would be significant because it would also push the stock back above its long-term 200-day moving average. Merck has been trading below that line since breaking down in August 2024, so reclaiming it would be a notable achievement.
If that happens, it could set the stage for a bigger reversal—with the best-case scenario being that Merck turns the 200-day into support as it continues its comeback.
The daily GoNoGo trend has been whipsawed since June, but over the last few weeks it has been firmly in an uptrend. For this to continue—and ideally strengthen—we’ll need to see a confirmed breakout.
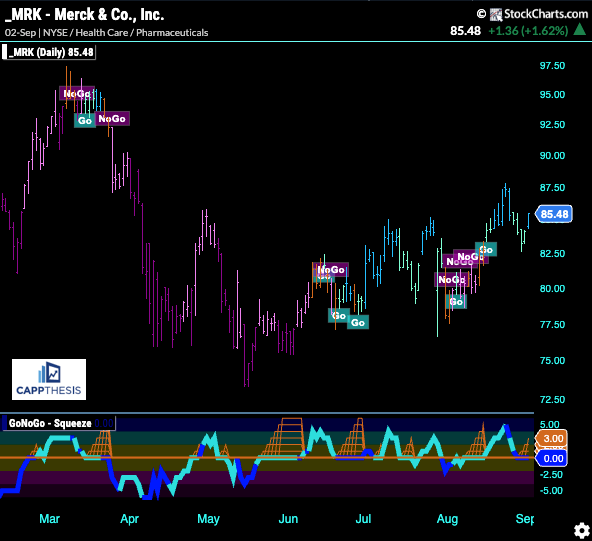
With the stock still trading close to its 2025 lows, the weekly GoNoGo trend has yet to turn higher.
This will be an important signal to watch, because as we know, after long stretches of negative momentum, a weekly GoNoGo flip—no matter the security—can often mark the start of a major trend change.