


TGIF - First, here’s a clip from my appearance on Stock Market TV’s Morning Show yesterday with JC Parets and Steve Strazza.
The Streak
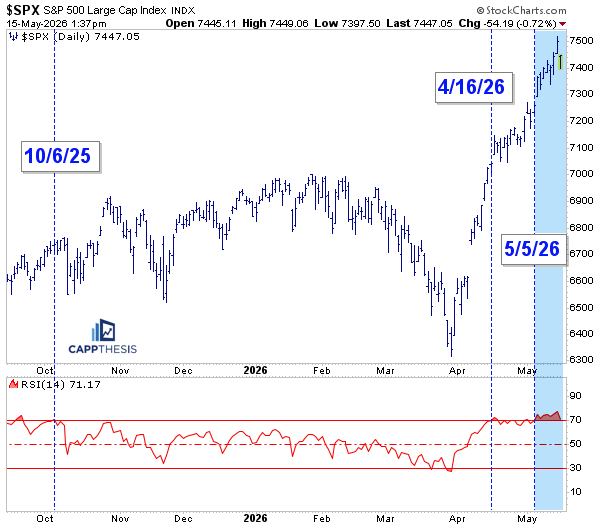
On April 16th, the SPX’s 14-day RSI crossed the 70-mark for the first time since October 6, 2025. While the indicator didn’t stay above the overbought threshold immediately afterward, it oscillated around the mark over the next three weeks.
Then, on May 5th, momentum accelerated again, with the RSI pushing back above 70 and then remaining there on a closing basis until yesterday.
That totaled eight straight trading sessions. Any kind of streak lasting eight days is lengthy and, more importantly, seldom happens.
August-September 2020
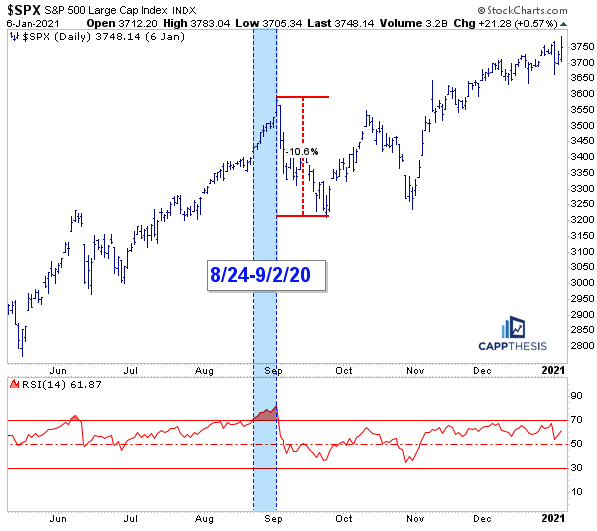
The last streak of eight or more consecutive overbought readings took place from 8/24–9/2/20. Back then, the SPX topped the very next day, suffering nearly a 11% decline immediately afterward. Naturally, that raises the question: should we expect something similar now?
Long Streaks since 1989
History gives us a mixed answer.
Looking back to 1989, the short-term returns after these overbought streaks have not been particularly impressive, but not bad either.
On average, the SPX was only slightly lower four weeks later, with gains occurring just 47% of the time, essentially a coin flip. However, the longer-term data paints a more constructive picture.
Three months later, the market was higher nearly 80% of the time.
12 months later, it’s a 94% win-rate.
This suggests that persistent overbought conditions have more often represented pauses within broader uptrends rather than outright exhaustion signals.
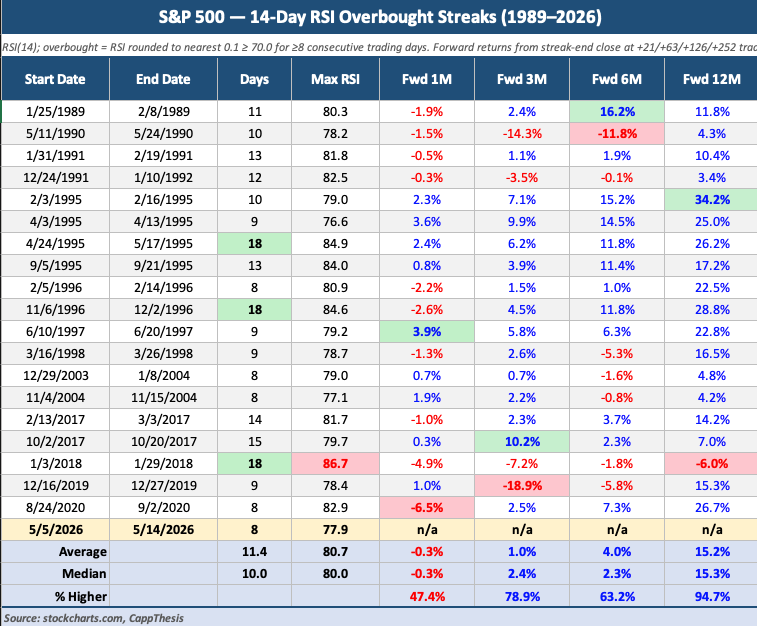
Of course, eight straight days is notable, but it’s far from unprecedented. We’ve seen significantly longer streaks over the years, including 18 straight trading days in both 1995 and 1996, along with another 18-day run in 2018. In other words, while today’s momentum has clearly been strong, it still doesn’t compare to some of the more powerful stretches of upside persistence seen historically.
The Internet Boom
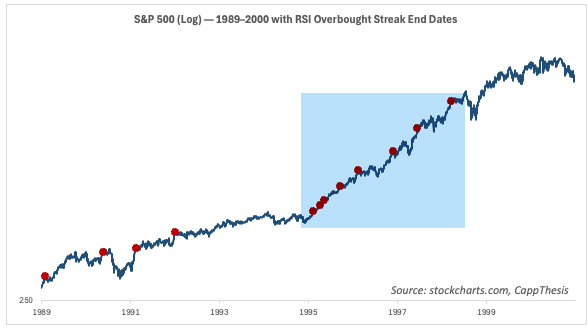
Perhaps the most eye-opening takeaway comes from the dot-com era, when momentum became almost relentless.
Between 1995 and 1998, there were eight separate streaks of at least eight straight overbought RSI readings.
Think about that for a moment — eight different occurrences in just four years. Persistent overbought conditions became a defining characteristic of one of the strongest bull markets in history.
Thus, from this perspective, the current environment still does not resemble the sheer consistency of gains seen during that period.
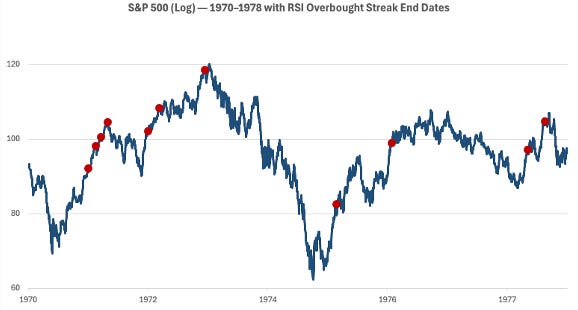
The Last 50 Years
Interestingly, though, the longest streaks of the last 50 years did not occur during the late-1990s technology boom. Instead, they happened much earlier, with the market posting 23 consecutive overbought sessions in 1970 and 24 straight sessions in 1971.
That’s an important reminder that these stretches are not exclusive to speculative, euphoric periods. Sometimes, they occur during powerful rebounds or broad-based trend shifts, when buyers simply continue overwhelming sellers for extended periods.
The bottom line is this: overbought conditions deserve respect, particularly after such a powerful run from the March lows. But overbought does not automatically mean bearish.
Bearish price action occurs when bullish patterns start to fail; so far, that has yet to happen.
CappNotes offers a small window into the work we do at CappThesis - a technical analysis newsletter company focused on classical chart patterns, trend, and risk management. Explore the full range of CappThesis services here: