


Happy Saturday - Here are five of the best charts discussed this past week. Also, check out my NYSE Live interview recorded yesterday morning.
Enjoy the rest of your weekend, and let’s go Knicks.
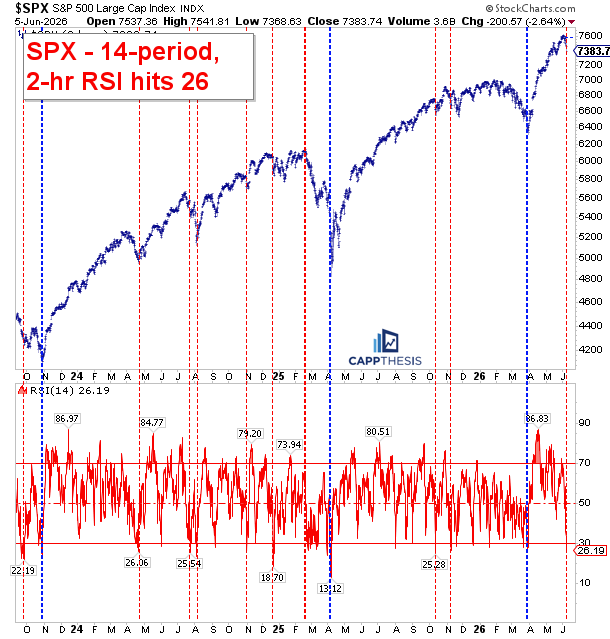
Monday, 6/8 - SPX starts the week extremely short-term oversold
With the 14-period RSI on the 2-hour time frame now at 26, it’s among the most oversold readings we’ve seen over the last few years. Most of the time, this has led to immediate bounces within ongoing uptrends since the 2023 low — not surprising. Three of those instances occurred right near major trading lows, highlighted by the bold blue lines, including the last one in March 2026.
One particular instance, however, occurred near a market top in February 2025. That, of course, came after a very strong 2024 advance. This time, the rally has also been strong, but not as extended if measured from the 3/30/26 low.
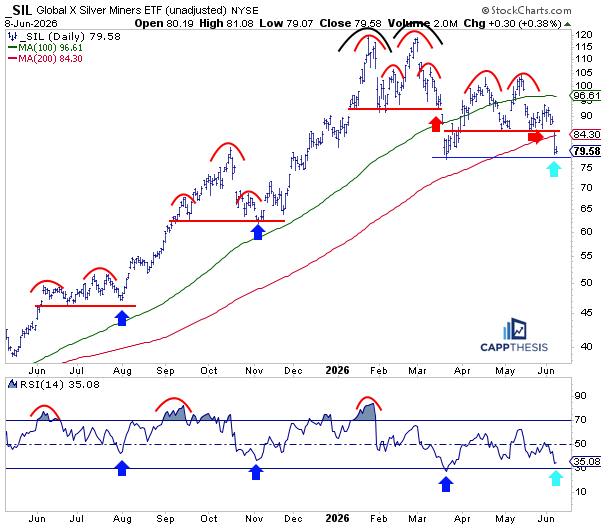
Tuesday, 6/9 - SIL Silver tests another key support zone
SIL has had a volatile ride over the last few months, but the one constant has been the emergence of bearish topping patterns. As it trended higher in 2025, those patterns failed to break down, encouraging eager dip buyers instead.
That, of course, has changed in 2026, with the price action trending mostly lower, though not collapsing. The March pattern breakdown produced only limited downside follow-through, but the ensuing bounce was also limited.
As a result, another topping pattern has now been triggered, and SIL has spent the last few days below its 200-day moving average for the first time since early 2025.
With the ETF now testing the March lows, dip buyers once again have a clear area to step in and a logical level to manage risk. The question is how much patience they’ll have if their efforts aren’t immediately rewarded this time.
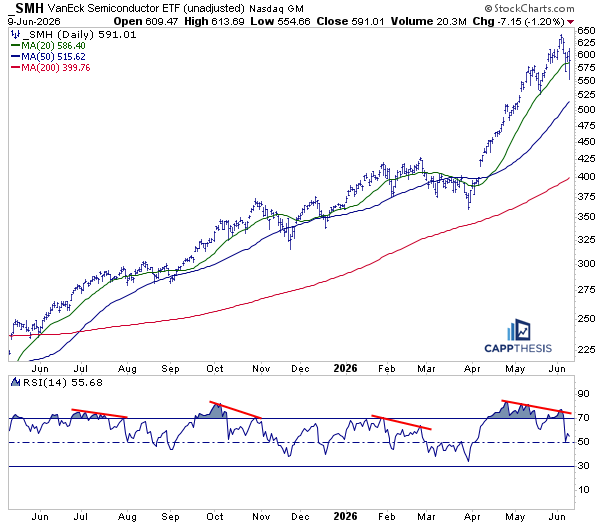
Wednesday, 6/10 - SMH vs. key moving averages
After just touching its 20-day moving average once from early April through early June, SMH has spent the last three days violently slicing through and reclaiming that line, as detailed in the intraday chart above. Again, this was bound to happen.
So, what’s next?
While the 20-day moving average isn’t the shortest-term trend indicator, it’s still short enough to remain relatively close to the price itself. That’s important because it means that after just a few days of back-and-forth movement, the average begins to catch up — both on the way up and on the way down. Again, it’s no surprise that we’re seeing that happen now.
At this point, it’s a matter of monitoring how well SMH behaves around the line. For example, how many days can it spend above it versus below it? This may sound obvious, but simply undercutting the moving average and then bouncing back above it is normal.
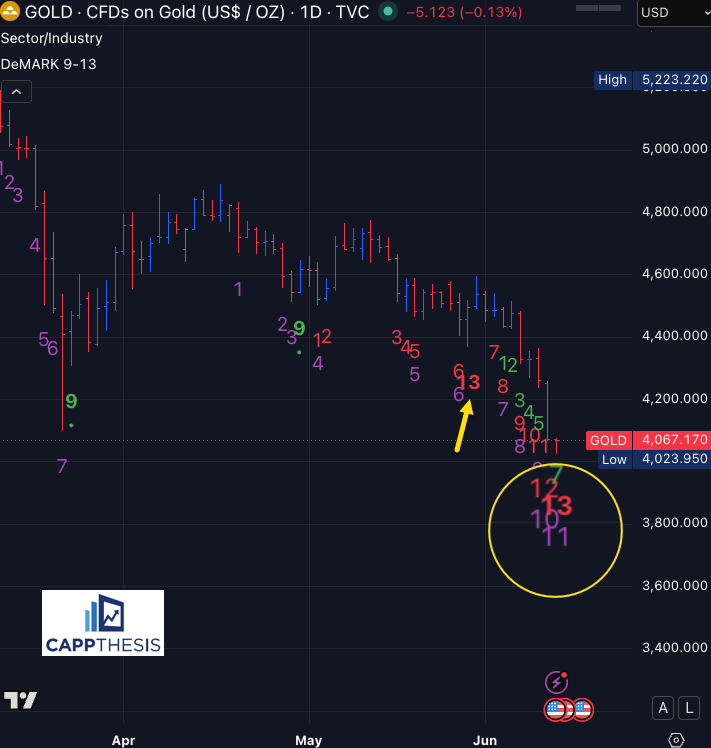
Thursday, 6/11 - Gold – Depressed enough to bounce?
With Gold continuing to weaken, a TD Sequential Buy 13 was triggered yesterday. This isn’t the first one we’ve seen, as there was also a signal in late May. However, buyers failed to respond to that setup.
This time, though, Gold is trading considerably lower, and with a potential TD Combo Buy 13 also approaching (11 of 13 currently), a meaningful mean-reversion opportunity could be setting up. As we know, it’s all about the follow-through… or lack thereof.
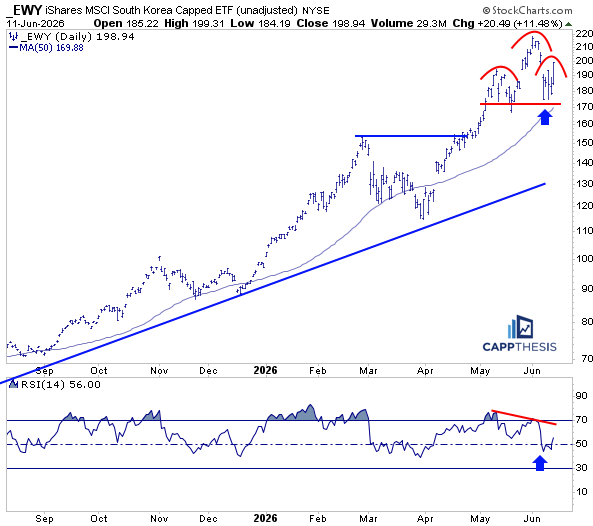
Friday, 6/12 - EWY South Korea – Avoiding the bearish pattern so far
As we know, Taiwan and South Korea have significant exposure to key parts of the AI and semiconductor space, so it’s not surprising that their charts continue to resemble SMH.
EWY South Korea has traced out a very clear potential head-and-shoulders pattern, though Wednesday’s 11% surge prevented a breakdown. Given the massive back-and-forth action of late, that formation — much like the one in the SPX — remains a possibility. For now, however, support has held.
CappNotes offers a small window into the work we do at CappThesis - a technical analysis newsletter company focused on classical chart patterns, trend, and risk management. Explore the full range of CappThesis services here:
These five are fabulous finds. Thank you for your excellent work!