


TGIF - To wrap up the week, we're revisiting five charts — one from each of our daily notes — exactly as they were originally published.
Have a great weekend.
And let’s go Knicks.
Monday, 6/1
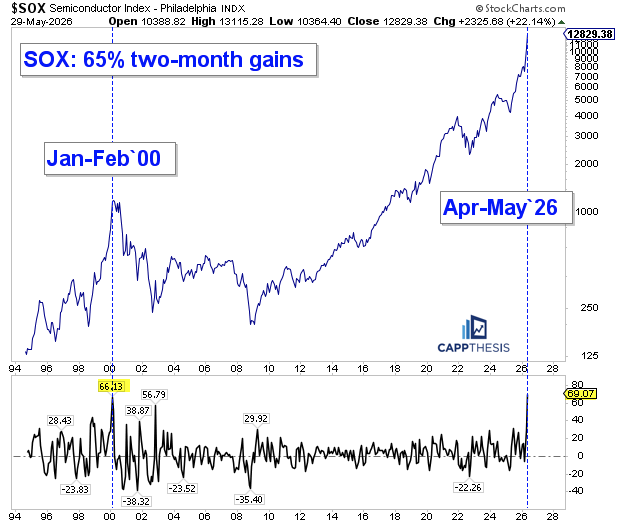
SOX Semis: +69% in two months
Not surprisingly, but still astonishing, the SOX Semiconductor Index is now up 69% over the last two months. The only other time it gained at least 60% over a two-month period was January-February 2000, just before the internet bubble peaked in March.
Of note, nearly all of that move came courtesy of February’s 50% surge. In March 2000, the SOX rallied another 17% at one point before reversing sharply and finishing the month with a gain of just 1%.
We all know what happened next.. Thus,it’s not the strength itself that should concern investors right now, but rather the potential for a major reversal.
Tuesday, 6/2
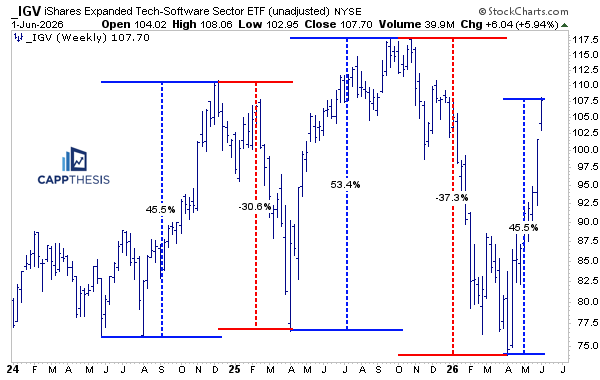
IGV – Epic Comeback or just another huge mean reversion
Since May 2024, now IGV has experienced five separate swings between 30% and 55%, with each one effectively reversing the trend that came before it. The chart highlights just how extreme the back-and-forth action has been. First a 45% rally, then a 31% decline. Next came a 53% surge, followed by a 37% drop. Now, the latest rebound has reached 46%.
In other words, what we’re seeing today isn’t unprecedented. In fact, it’s become a defining characteristic of software stocks over the last two years. So the real question isn’t whether IGV can extend an oversold bounce. It already has.
The question is whether the ETF can finally break this cycle of violent reversals and push above its former highs. If it can, this latest advance may prove to be something much more important than just another mean-reverting move
Wednesday, 6/3
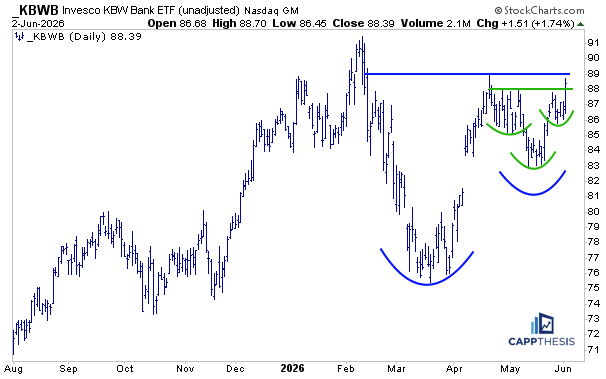
KBWB Banks – Two potential bullish setups
KBWB includes the large money-center banks AND regional banks, looks very similar to KRE. In fact, this ETF appears even closer to completing a sizable bullish cup-and-handle pattern.
Along the way, it has also formed a smaller but well-defined inverse head-and-shoulders pattern. In many ways, that entire formation has helped create the handle portion of the larger cup-and-handle setup.
A breakout above the 89-resistance area would complete the pattern and project an upside move that extends well beyond the ETF’s prior highs from earlier this year. For now, KBWB remains one of the more compelling, untriggered bullish setups within the financial sector.
Thursday, 6/4
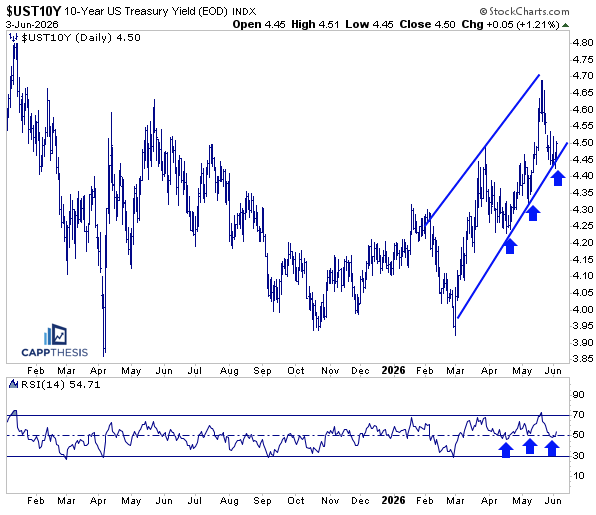
10-Year Yield
A key driver behind the SPX’s nine-day winning streak was the sharp decline in interest rates after the 10-year Treasury yield briefly spiked toward 4.7% in mid-May.
That pullback brought the 10-year yield back into the mid-4.40% range and down to the lower boundary of the upward-sloping channel that has been in place since the March lows. While rates are typically characterized by jagged price action, the recent broader trend of higher lows remains intact.
Prior tests of this uptrend line led to fairly strong rebounds in yields. If that happens again now, especially with the SPX’s nine-day winning streak having just ended, it could become a headwind for equities, at least in the short term.
Friday, 6/5
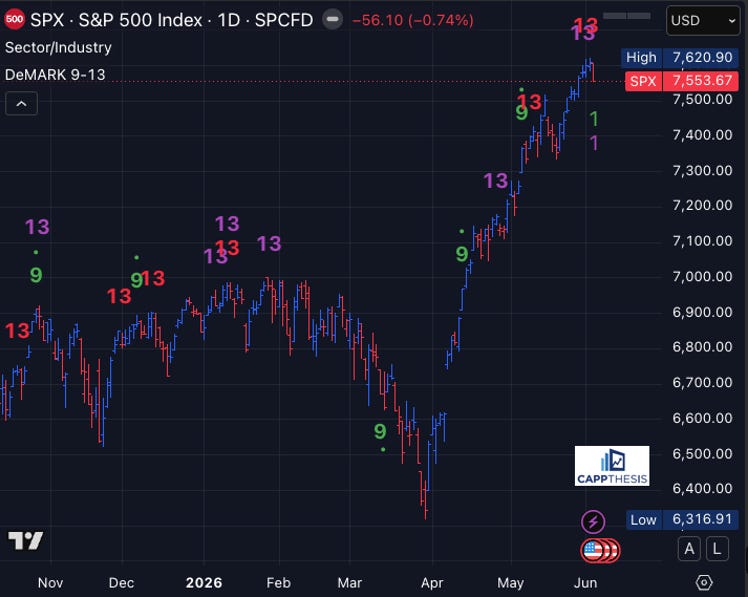
SPX – DeMark Update
We actually was first shared on Thursday and again this morning
Keeping tabs on the DeMark work, two Sell 13s recently registered on the same day. Again, the strongest trends can persist despite various Sell 13 signals, but when other indicators begin to line up alongside DeMark, we should at least be aware of it.
With that now happening, we’ll be watching closely for any additional downside follow-through this time. And the very least, the next real bout of profit-taking should provide insight into how the next period of consolidation unfolds, specifically whether the next pattern takes on a more bullish or bearish character.
CappNotes offers a small window into the work we do at CappThesis - a technical analysis newsletter company focused on classical chart patterns, trend, and risk management. Explore the full range of CappThesis services here: