


TGIF - A busy week draws to a close — and while much has shifted, our core focus remains unchanged. Below is a glimpse of today's Opening Look premium pre-market commentary. Have a great spring weekend.
Key Points
The SPX tacked on its seventh straight gain on Thursday, which, as we know by now, is the longest streak since the period ending October 6th, 2025. More importantly, in the early stages of last year’s comeback, the SPX logged a nine-day winning streak from April 24th to May 2nd. That move came after a key higher low and was a major part of setting the stage for the multi-month rally that followed.
Today, we take a close look at that period and dissect a number of charts that have materially changed over the last week.
Patterns – A lot of changes
Naturally, with the strong pop on Wednesday and yesterday’s continuation, a lot has changed across nearly every SPX chart we track, including the patterns.
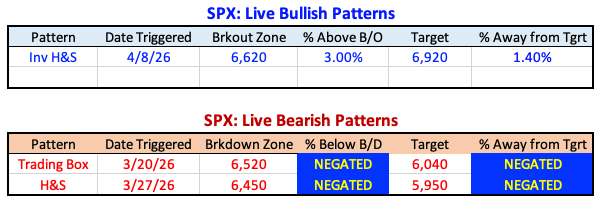
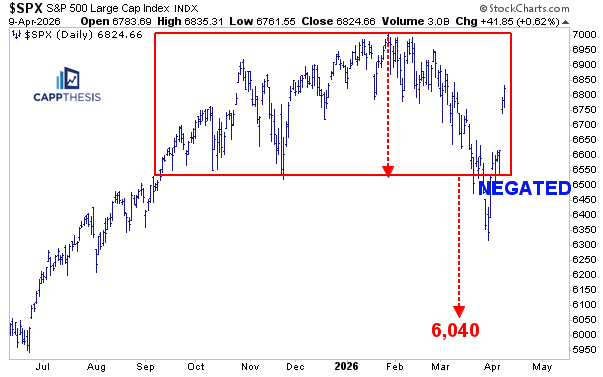
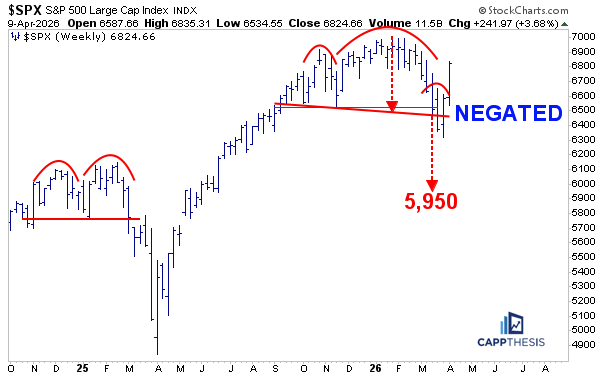
Starting with the bearish patterns, as we discussed back on April 2nd, the SPX had already pushed back above the breakdown zones of both the large trading box and the bearish head-and-shoulders pattern. We kept those on the pattern grid given the elevated volatility but importantly noted the lack of downside follow-through after those breakdowns.
At this stage, both patterns are no longer in play. For a bearish scenario to re-emerge, it would take time to develop, including a meaningful reversal lower following this recent rally.
The Bullish pattern
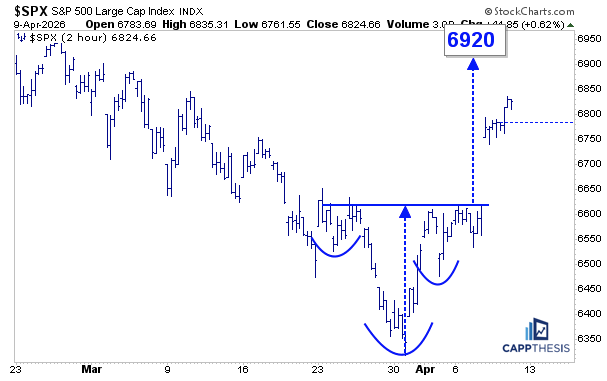
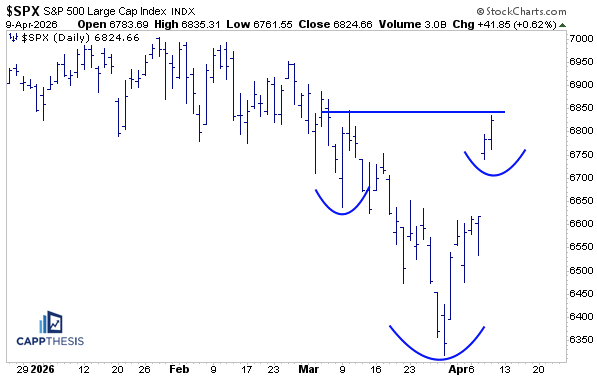
We have been discussing the potential for a small bullish formation to take shape over the last two weeks. The initial attempt in the first two days of April failed to push the SPX through late-March resistance, but with Wednesday’s sharp move, the inverse head-and-shoulders pattern was officially triggered.
The upside target of 6,920 is now within reach—just about 1.4% from last night’s close. While that’s very close already, prior rally attempts failed to make any progress against the series of lower highs. Thus, acquiring any upside target would represent a meaningful shift in the market’s character.
The Next Bullish pattern
Again, the goal isn’t just to see a short-term upside target hit. That’s constructive, but we track these on an intraday basis first to help identify when a larger formation can begin to take shape.
On the daily chart, we can see how that process may already be unfolding. We don’t need to see an immediate extension of this seven-day winning streak. Some consolidation at these levels would actually be healthy, as it could help form the right shoulder of a much larger inverse head-and-shoulders pattern.
This mirrors what we saw from April into May 2025, where the initial short-term breakout set the stage for a broader formation, ultimately leading to the sustained uptrend that followed. More on this below.
A Familiar Setup – Revisited
Over the last week, we shared this chart comparing the pullback this year to what unfolded in 2025. It was, by far, the most popular post I’ve ever put on X, receiving over 550,000 views, with most of the comments leaning bearish.
The point of the chart was to show that, while this year’s pullback was similar and produced the first oversold reading, the key factor came in the follow-through attempt. In March 2025, the ensuing rally failed at the 200-day moving average, with RSI staying below 50.
This time, the SPX’s seven-day winning streak has pushed it decisively back above the 200-day moving average, with RSI now in the 60s. That’s a clear contrast versus last year’s failed attempt.
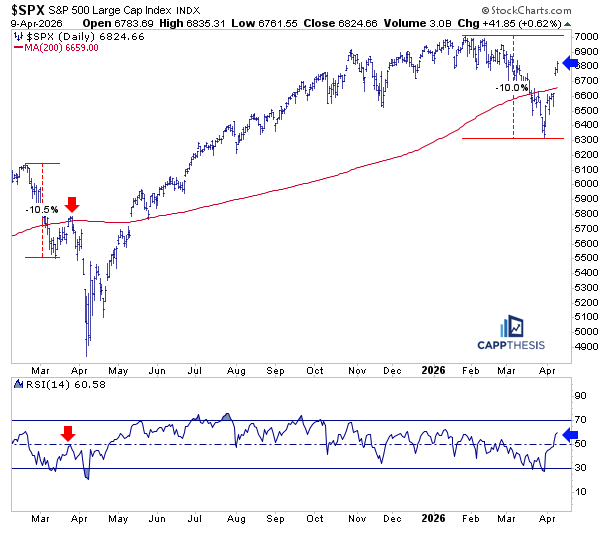
When that effort in March 2025 didn’t encourage upside follow through, the index ended up not producing a bullish pattern. Thus, that late-March rally attempt failed and quickly gave way to the waterfall decline over the following days.
That’s a stark difference to what developed a few weeks later a year ago – the key higher low formed on April 21st. We noted this last week:
“…it produced a key higher low on April 21st. That was the turning point—buyers stepped in at higher levels, and it set the foundation for the advance that followed over the next several months. At this stage, forming a higher low is critical if this is going to evolve into a more constructive, bullish setup.”
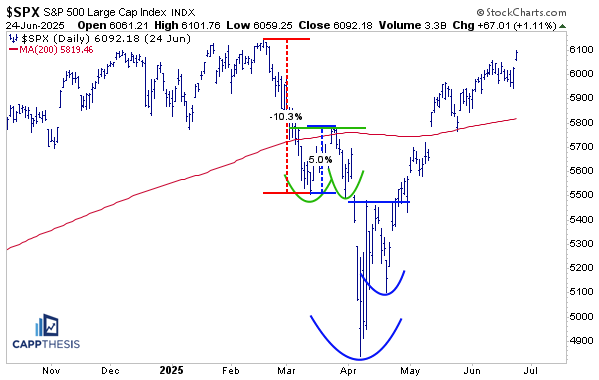
This brings us back to the current trading environment, which, in hindsight, suggests that last week’s low point was the key higher low we’ve been looking for… and now it has been successfully leveraged. The next step is for this move to morph into a larger structure, as outlined above.
Short-Term – Back to overbought
Last week we said this:
“Ideally, we’d like to see the (short-term) indicator reach overbought territory as the SPX overtakes the last short-term high just above the 6,650 zone. That would improve the technical backdrop and increase the odds of the index being able to absorb a pullback and produce a higher low, which will be key going forward.”
That’s now happened.
Tactically, the short-term pendulum has now swung fully back to the overbought extreme, which we don’t expect to persist for much longer. More consolidation and profit-taking over the near term, therefore, would not be a surprise at this stage.
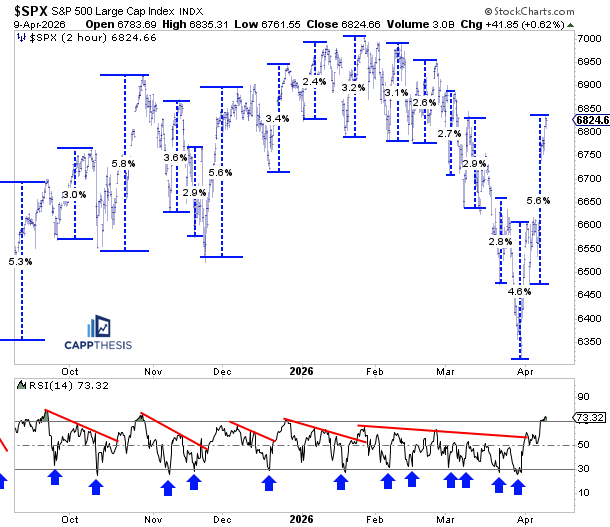
Chart Trades
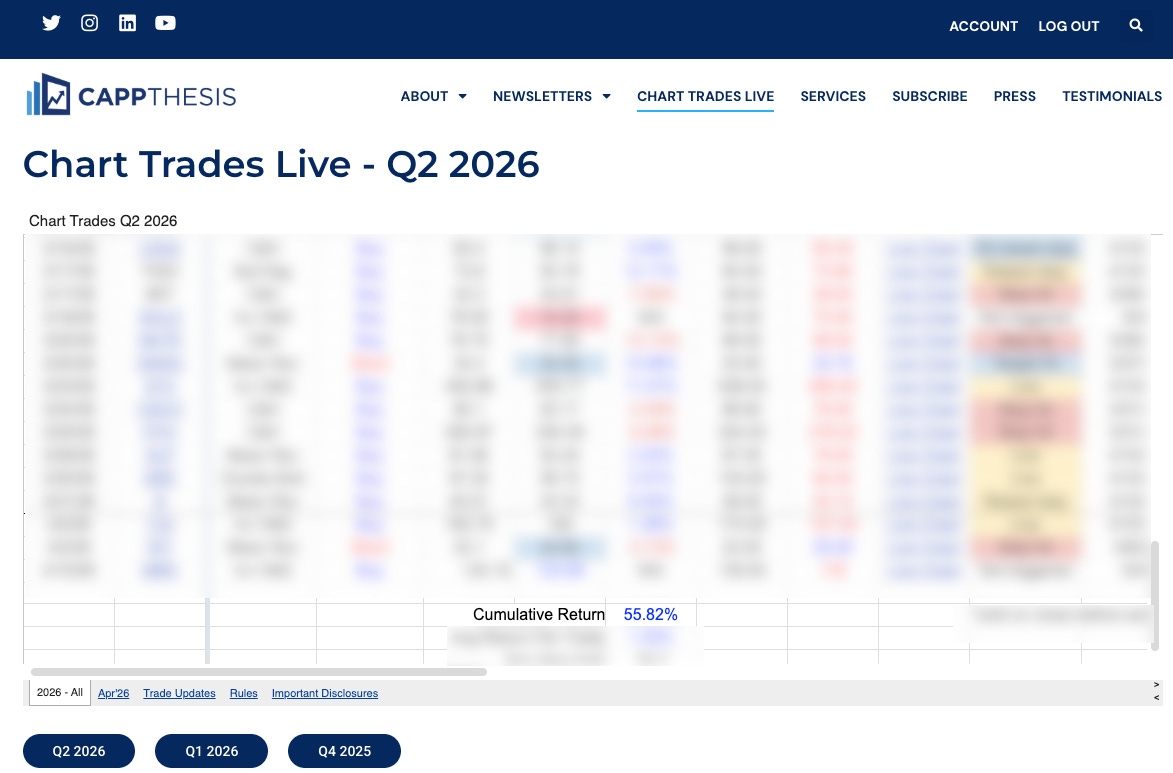
The recent move validated several of our recent trade ideas, with WFC, TXN, and TIGO among those already hitting their upside targets — while others continue to trend in our favor. The scorecard speaks for itself: 10 of our last 15 trade ideas have been profitable, spanning both long and short positions, with a cumulative YTD return of +55% — updated live in the Chart Trades Live section of our website.
Today’s Chart Trade idea is a popular name that has formed a potential inverse H&S pattern…
CappNotes offers a small window into the work we do at CappThesis - a technical analysis newsletter company focused on classical chart patterns, trend, and risk management. Explore the full range of CappThesis services here:
Love the way you look at the charts, always learn a lot, many thanks
Sería posible el patrón de 2022 en vez de 2025?... La situación puede parecerse más si finalmente la inflación persiste. Gracias por el contenido