Breadth & a Trade Idea
Dissecting the positive breadth divergence and a recent Chart Trade Idea
TGIF - Here’s an excerpt from yesterday’s morning note, which has been getting great feedback.
Enjoy your weekend. Best, Frank
The Huge Breadth Divergence
An astute CappThesis client pointed out that the NYSE cumulative advance-decline line had recently made a new all-time high (h/t SP).👊
Admittedly, I hadn’t looked at many cumulative adv-dec lines lately, given how far the SPX and others still are from their respective highs. But after hearing that, I took a peek at the SPX’s advance-decline line. It ALSO made a new all-time high last Friday (5/2/25). The divergence between this and the SPX itself is glaring, to put it mildly.
How can this happen?
First, let’s remember that the last time the adv-dec line made a high was in late November. That was followed by 14 straight negative breadth days to start December — the “field” was getting hit hard while mega cap growth stocks continued to advance. This helped the SPX stay near its highs…
…until mid-February.
📉That, of course, was when the MAG 7 and others finally came under pressure. The ferocious unwind hit the SPX, the NDX, and others. “Safer” sectors and industry groups, while also weak, noticeably outperformed. As a result, the adv-dec line didn’t fall as much either.
Here’s the daily percentage of advancing S&P 500 stocks since the April 7th pivot low:
There’s been more positive breadth days than negative recently. More importantly, we’ve seen a handful of EXTREMELY strong internals: three 90% days, three 80% days, and four 70% days. ✅
That compares to just one -90% down session, three -80% days, and one -70% day.
And that’s been enough for the adv-dec line to hit new highs.
The obvious question: will the SPX itself follow its lead?
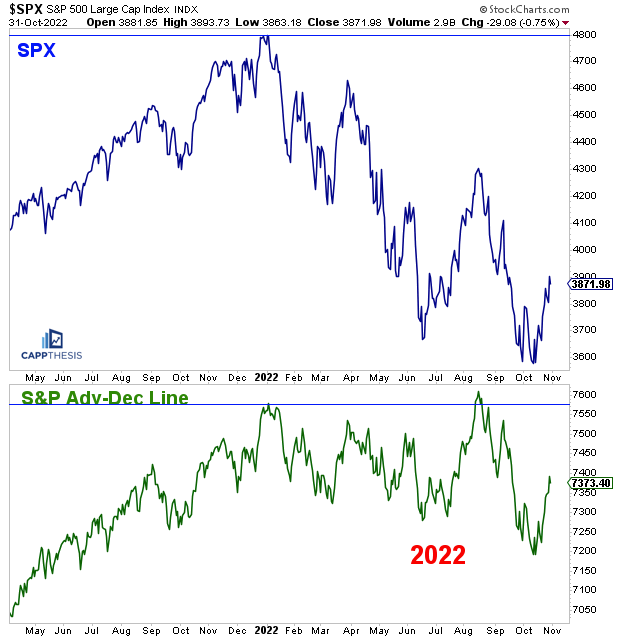
The Huge Breadth Divergence… in 2022
We’ve seen this kind of massive divergence before… In August 2022, the SPX’s cumulative adv-dec line also made a new all-time high — just as the SPX itself had rallied 20% in a few weeks. The worst seemed to be over… until it wasn’t. ❌
So, how does that help us now? Well, the one thing that was NOT working back then was:
👉 Bullish chart patterns.
And that’s why seeing the current bullish setups continue to hold is so important now.
TSLA
TSLA was a clear laggard from early December through mid-March. But as nearly every key index, ETF, and stock aggressively undercut its mid-March lows when tariffs took hold through early April, TSLA respected its own March low.
Since then, it’s been backing and filling under its flat 200-DMA.
While the stock fading near that line around 290 has been frustrating, it’s been forming a potential inverse H&S pattern for nearly two months. Eventually busting through the 290 area could really trigger momentum, especially with the light air pocket of supply above that level. We remember how quickly that same zone was filled on the way down.
A breakout would target 368.⚡️
🔥 Lastly, check out my latest LinkedIn post here about why having confidence in a trade is a NEGATIVE.


Great analysis Frank.
Have a good weekend.