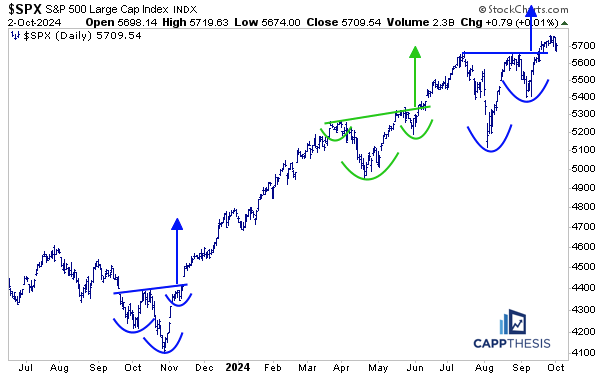
1- The SPX remains above its most recent pattern breakout zone (5,650), having moved sideways over the last two weeks.
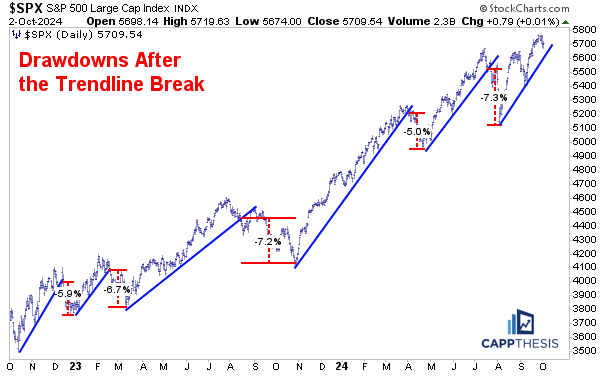
2- The index’s biggest drawdowns all happened as the index cut through key uptrend lines. It’s getting close to testing another line now, stemming from the August lows.
The Biggest Breakouts
Needless to say, not much changed from a technical perspective after yesterday’s non-movement. And with the price action having noticeably slowed ever since the breakout to new highs on 9/19, momentum has stalled, too.
Again, this isn’t a negative, at least not yet. Two weeks ago, we talked about the potential next phase – one of lower two-way volatility. We pointed to the November’23 and May’24 periods as recent examples: calmer, consistent price action followed big pattern breakouts.
The Biggest Drawdowns
That said, it IS October, thus, there’s another very important angle to consider…
With the SPX simply moving sideways the last two weeks, it’s quietly crept closer to the uptrend line that connects the August and September lows. Since the October’22 low, it’s clear that the biggest drawdowns all happened as the index cut through key uptrend lines. We’ve shown this chart before, and it’s a significant one to keep in the back of our minds again now.
This is more useful than a chart showing the total peak-to-trough declines because there’s no way to know when any particular high point is the actual peak… until after the fact.
As is clear, most of the downside action happened after the trendline breaks over the last two years, thus, it makes sense to wait for the breach. This approach would have kept us in the longest runs in the spring’23 and from November’23 – March’24… while allowing us to get out before the larger part of the decline took hold….