


Good morning - Below is an excerpt from the data and market sections of today’s Opening Look.
Also included is our most recently closed Chart Trade, which the model exited this morning for a 17.8% gain in 20 trading days, along with the original write-up and charts that accompanied the trade idea.
Key Points
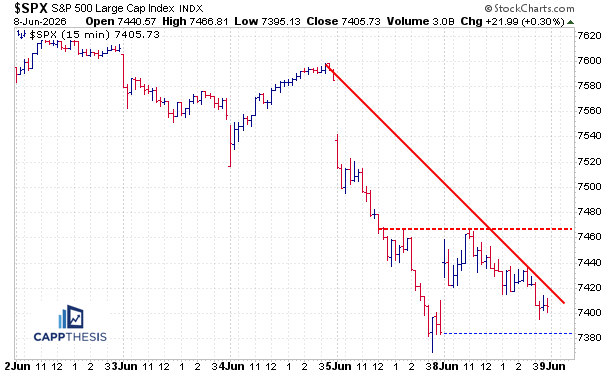
The SPX snapped back on Monday, but in unimpressive fashion, fading by late morning and finishing below its intraday midpoint. Bears are understandably calling it a dead-cat bounce, and the only way that view is proven wrong is with a stronger follow-through effort in the days ahead.
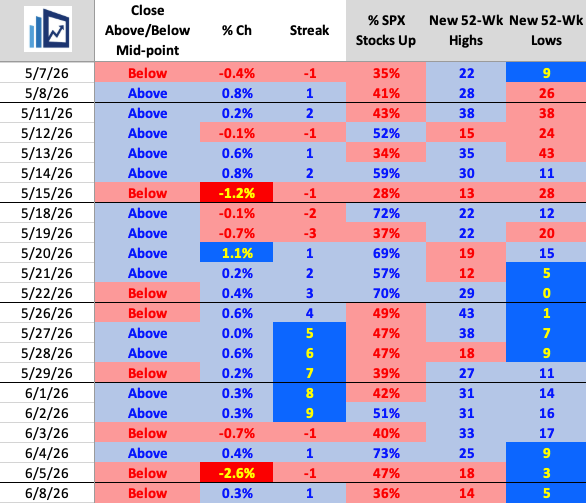
Last Five Trading Days
Daily Price Action
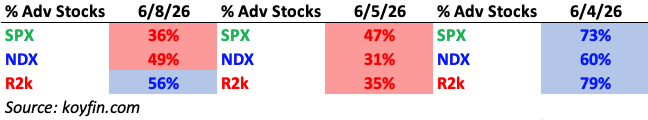
Ironically, yesterday’s internals were noticeably worse than Friday’s, despite the SPX performance being nearly 3% better.
Breadth
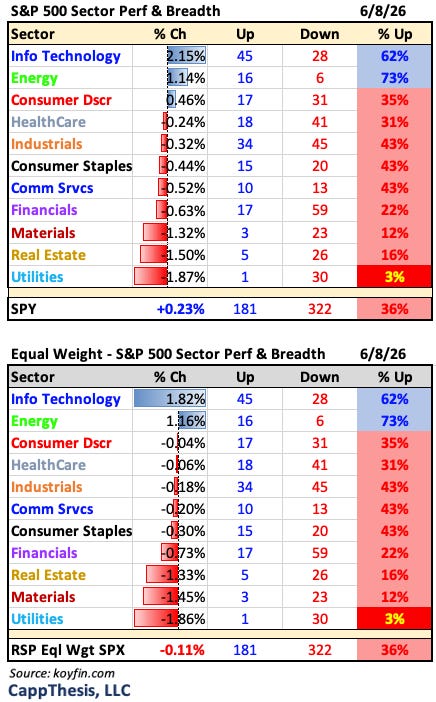
Sectors
Technology did bounce back well, but the 2% gain barely dented Friday’s 7% drubbing. And only 62% of its components advanced, another sign that participation within the sector was far from overwhelming.
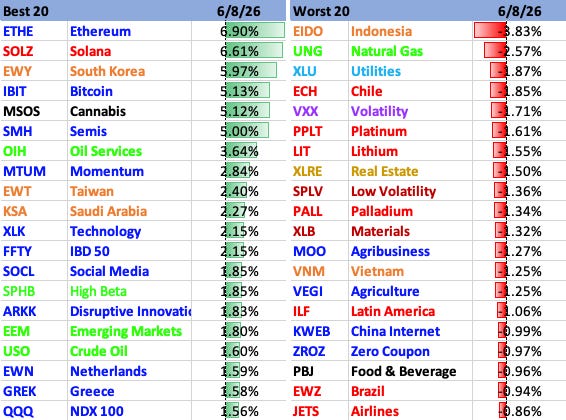
Best & Worst 20
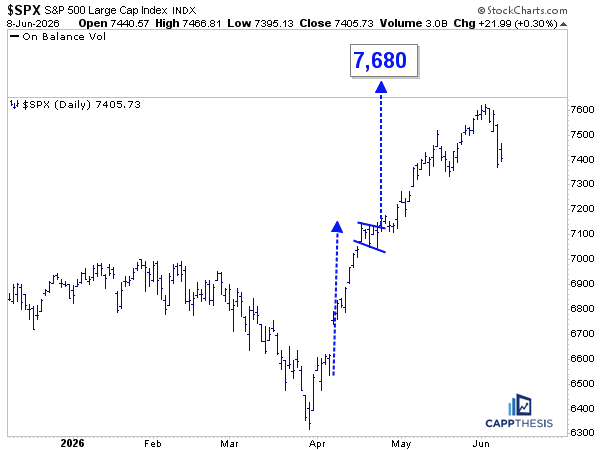
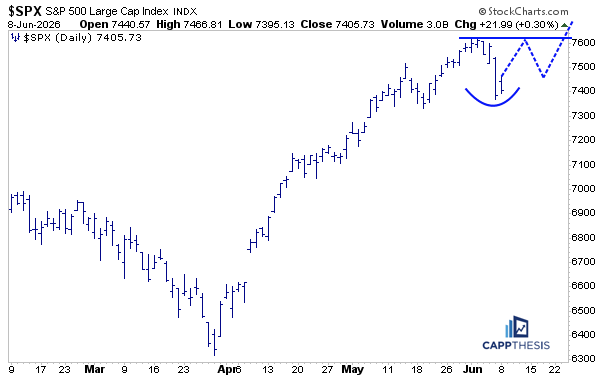
Bull flag still holding on for now
The 7,680-target derived from the bull flag remains in play. That big cushion it built up has kept it alive for now…
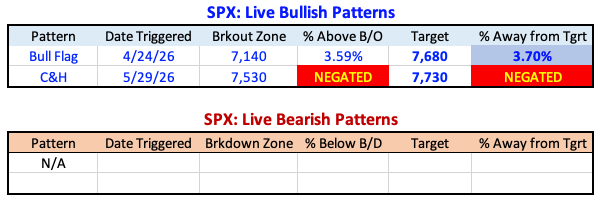
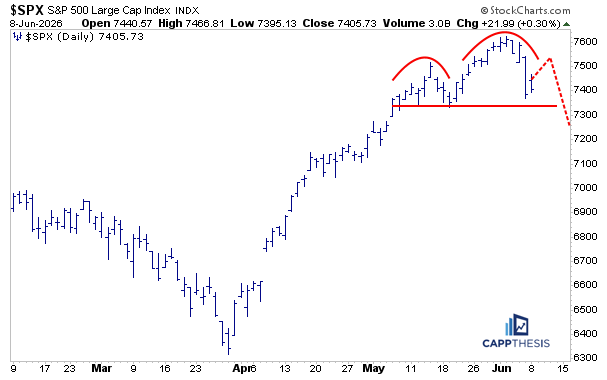
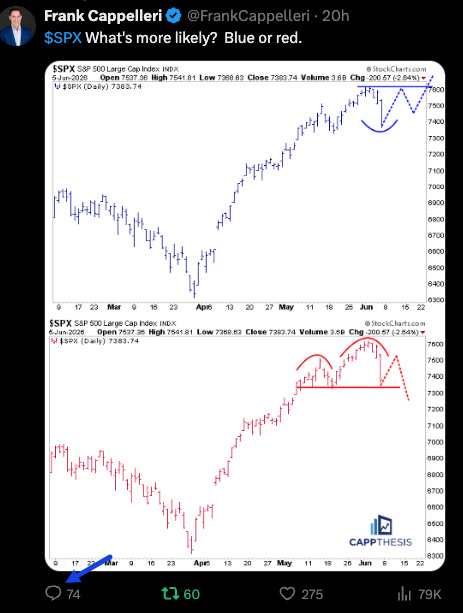
Potential Patterns
Both bullish and bearish potential patterns remain viable after yesterday.
I posted this on X yesterday morning, and it generated a lot of engagement, with more than 70 comments as of early this morning. Not surprisingly, the initial responses were tilted bullish, but they became increasingly bearish as the day wore on and the market began to lose steam.
Translation: price dictates sentiment. My interpretation is that traders still want to buy the dip, but they’re hesitant about getting run over. As a result, many will likely wait for more confirmation and then chase it higher if and when the SPX gets back to new highs.
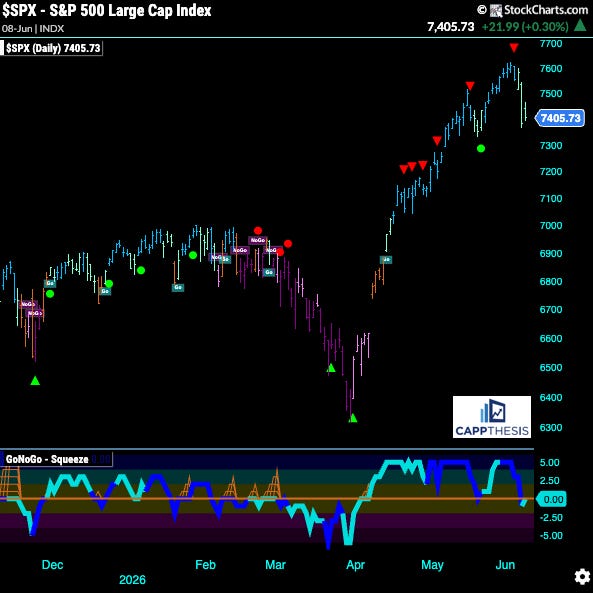
GoNoGo Daily – Remains in go
As noted yesterday, we’re watching to see how much downside follow-through develops from here, whether the indicator flips back to Neutral or NoGo, and if the market can remain within a defined uptrend. Assuming it does, the next question becomes when and where the next green dot — a short-term buy signal — appears.
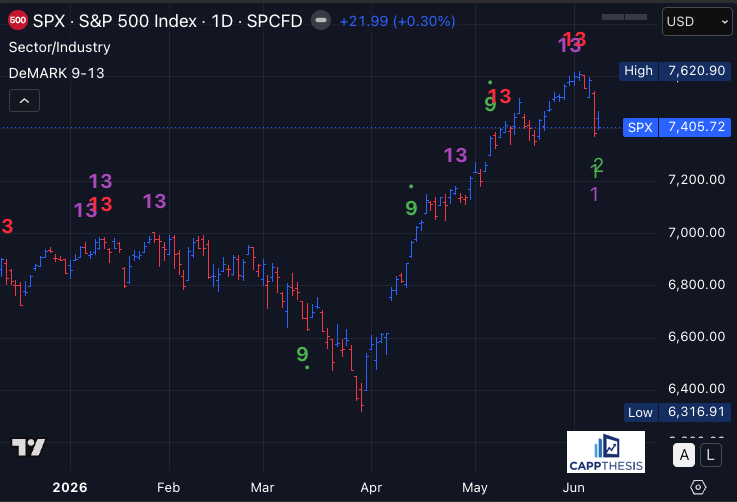
SPX – Daily DeMark
While it will take some time for another 13 to show up from either side, a Setup countdown is now on 2 of 9.
Here’s what that means… As described by the official Demark website:
“A 9 indication marks a completion of the Setup phase in the Sequential and Combo family of indicators. The 9 output looks for a series of consecutive price comparisons to define the underlying environment. Generally speaking, these 9 results are often followed by a price reversal, with the impact and duration defined by other elements of the indicator.”
Bollinger Bands – Approaching the lower line
Through last Thursday, the SPX had spent nearly all of its time trading between the upper Bollinger Band and the middle-dotted line (20-day moving average). With the index aggressively piercing the 20-day line on Friday, it’s now less than 100 points away from the lower band.
Reaching that lower band is certainly possible. What does it mean if it gets there?
As we may recall, the first real dent in the armor during the 2025 comeback occurred in late July and early August. In particular, the 8/1 decline pulled the index all the way down to the lower Bollinger Band while simultaneously triggering a bearish pattern, which was then quickly and powerfully reversed.
Thus, seeing how well the index responds to both of these potential scenarios again will be telling. For now, we’ll first need to see a better effort to believe the bid truly has returned.
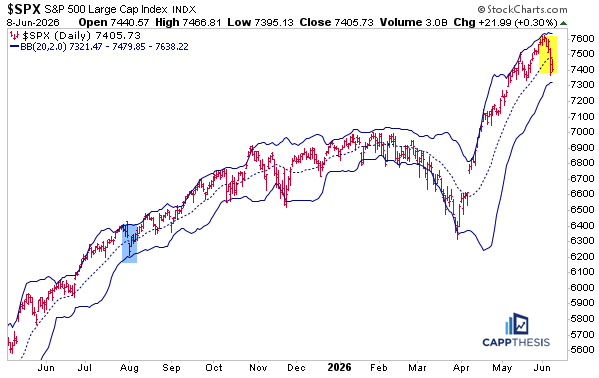
Chart Trades
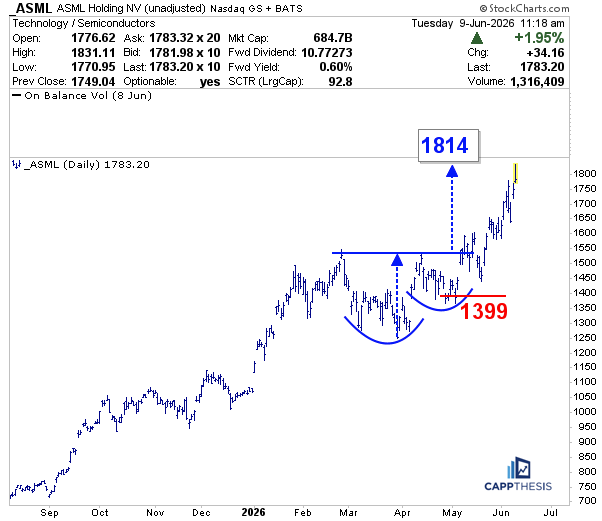
ASML
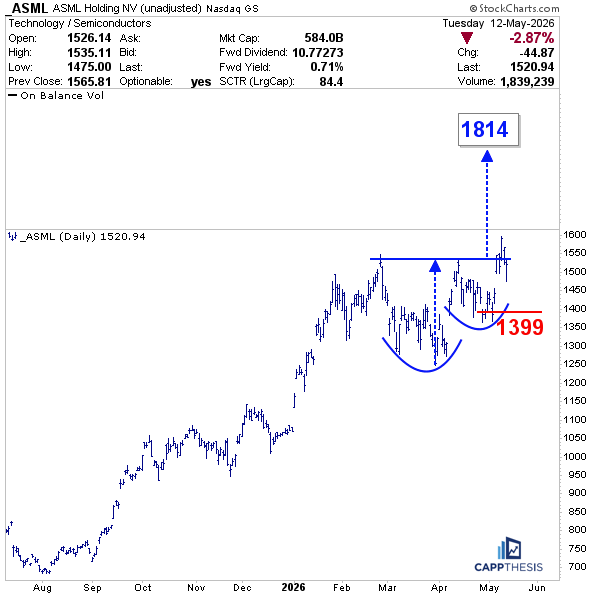
Bought: 5/13/26
Sold: 6/9/26
+17.8% in 20 trading days
Original note from 5/13/26:
As just discussed above, rotation can occur between sectors, between groups within sectors, and even within sectors among individual stocks. That could create opportunities in names that have lagged but are quietly building constructive setups.
While many semiconductor stocks have exploded higher over the last few weeks, some have yet to fully break out. ASML fits that description.
The stock appears to be tracing out a potential bullish cup-and-handle pattern, while also doing a good job steadily regaining ground since reporting earnings last month. Rather than immediately surging higher, the stock has been consolidating in a more controlled fashion, which can often help build a stronger foundation.
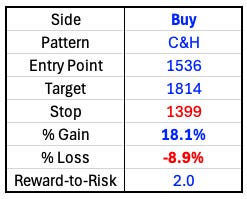
If ASML can finally leverage the pattern and break higher, the upside target would come into focus near 1,814. A stop loss near 1,399 helps define risk.
CappNotes offers a small window into the work we do at CappThesis - a technical analysis newsletter company focused on classical chart patterns, trend, and risk management. Explore the full range of CappThesis services here: