


Good afternoon,
Below are excerpts from the past two Opening Look reports, covering the S&P 500 and a pre-earnings technical preview of TSLA.
Also, check out these two links:
👉 My recent StockCharts TV YouTube video.
👉 My appearance on CNBC’s Morning Call this morning.
Back-to-Back Bad Breadth Days: Warning Sign or Buying Opportunity?
Weak market breadth has been one of the defining characteristics of the last several sessions.
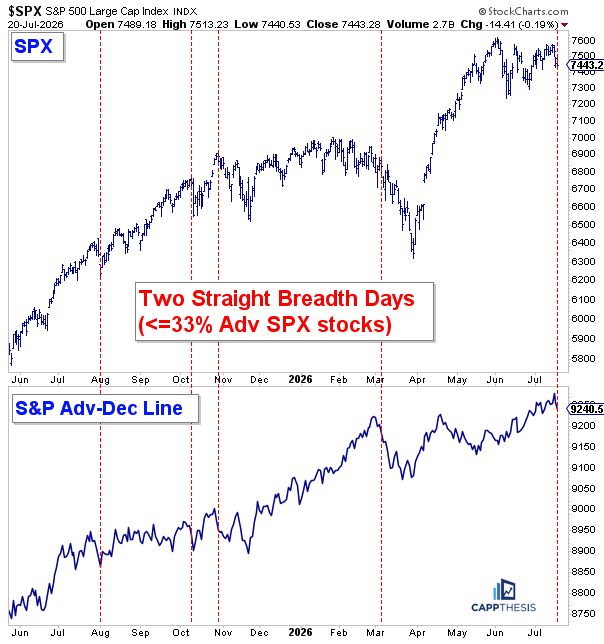
In fact, the S&P 500 just recorded two consecutive days with fewer than one-third of stocks advancing, with just 29% of stocks higher on Friday followed by 33% on Monday. While that certainly reflects a deterioration in participation beneath the surface, history suggests this setup deserves additional context before drawing bearish conclusions.
Recent History Shows Mixed Immediate Outcomes
Since last August, this exact setup has occurred four other times.
The two most recent examples developed during corrective phases. The early March occurrence took place in the middle of what ultimately became a multi-week pullback, while the late October 2025 signal preceded several additional weeks of weakness.
However, the two earlier examples tell a different story. Similar breadth washouts in early October and early August of last year coincided with important trading lows that ultimately led to meaningful advances.
This is why breadth signals should rarely be viewed in isolation. The accompanying advance-decline line helps determine whether these weak readings are occurring within a deteriorating long-term trend or simply represent a temporary washout inside a broader uptrend.
A Look at Every Occurrence Since 2024
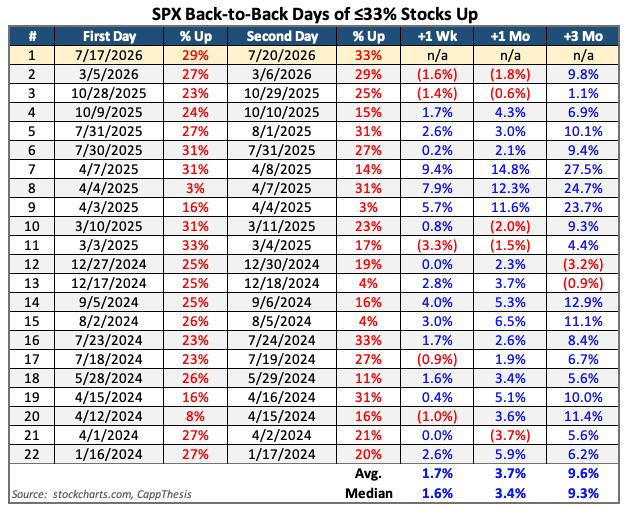
Stepping back further, there have now been 22 instances of consecutive days with fewer than 33% of stocks advancing since the beginning of 2024.
Not surprisingly, every occurrence clustered during periods of market weakness:
11 during 2024
9 during 2025
2 so far in 2026
Perhaps the most important takeaway is where these signals have typically appeared.
Rather than marking major market tops, they have generally occurred after weakness had already developed.
On average, the S&P 500 was already down 3.0% over the previous week and 2.0% over the prior month before the signal appeared. That suggests these breadth collapses have historically been more consistent with short-term exhaustion than the beginning of a larger decline.
Forward Returns Have Been Encouraging
Looking ahead, the historical results have been constructive.
Following these breadth washout signals, the S&P 500 produced:
+1.7% average return over the next week (76% positive)
+3.7% average return over the next month (76% positive)
+9.6% average return over the following three months (90% positive)
While no single indicator should be used in isolation, the data suggest these episodes have generally rewarded investors willing to buy into periods of broad-based selling rather than react emotionally to them.
What It Means Today
The current occurrence (July 17-20) fits many of the same historical characteristics. It has developed after a modest pullback, weakening participation, and growing short-term pessimism.
That does not guarantee the recent weakness is over. Some past occurrences required additional downside or several weeks of consolidation before a durable low was established.
Still, the broader historical message is clear: back-to-back poor breadth days have generally been signs of short-term capitulation, not long-term deterioration.
The sample size remains relatively small and, admittedly, benefited from the strong bull market environment of 2024-25.
Nevertheless, recent history suggests these types of breadth washouts have more often represented opportunities to buy weakness than reasons to become materially more defensive.
Pre-Earnings Chart Setup: Tesla (TSLA)
With earnings season now underway, technical setups become even more important. While earnings headlines often dominate the immediate reaction, the underlying chart frequently determines whether that reaction develops into a lasting trend or quickly fades.
As a reminder, we do not recommend new Chart Trades once a company is within two weeks of reporting earnings. The goal is to avoid company-specific event risk when a trade is based solely on technical analysis.
That said, it remains important to understand where the market’s largest stocks stand heading into their reports—particularly with two Magnificent Seven companies reporting after today’s close.
TSLA Has Been Building a Highly Volatile Topping Pattern
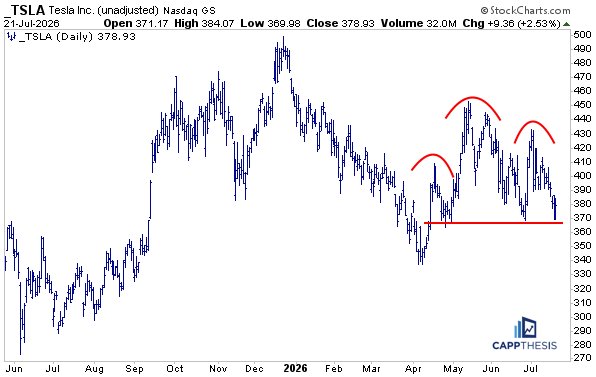
If one word describes Tesla’s chart over the last several months, it would be messy.
The stock has traced out a clear—but still unconfirmed—potential topping pattern, with major support centered near 365. That level will once again serve as the line in the sand following today’s earnings report.
The Bigger Picture Remains Choppy
Stepping back to a longer-term view highlights just how erratic TSLA’s trading has become.
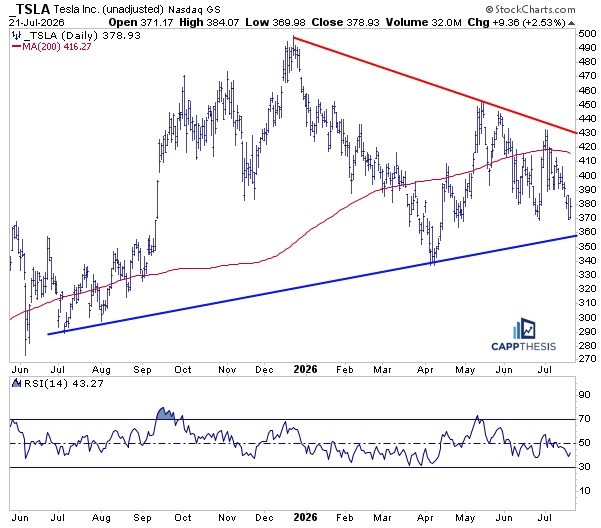
Following a powerful advance from the June 2025 low through the September peak, the stock has transitioned into a series of wide, emotionally driven swings. Much of the recent price action has been dictated by the sharp decline from the December high to the April low, which established the trading range that continues to contain prices today.
Like much of the broader market, Tesla staged an impressive rebound during the first two months following the April low. Unlike many other leadership stocks, however, that recovery has failed to build momentum. Each subsequent rally has stalled below the previous peak, creating a pattern of lower highs that reflects fading buying pressure.
A Symmetrical Triangle Is Approaching Resolution
The longer-term consolidation has now evolved into a large symmetrical triangle, a pattern that typically represents a period of equilibrium before an eventual directional move.
Importantly, the triangle’s lower trendline converges almost exactly with the 365 support zone, reinforcing that area as one of the chart’s most important technical levels.
With earnings acting as a potential catalyst, the stock may not remain within this narrowing range much longer.
Why SPCX Investors Should Also Be Paying Attention
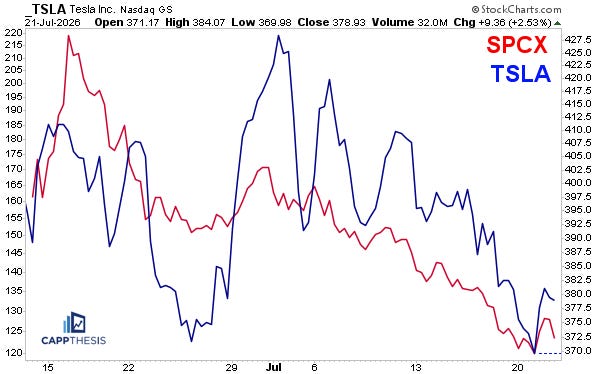
Over the past several weeks, TSLA has increasingly been discussed alongside SPCX.
SPCX has been considerably more volatile—particularly following its sharp decline after its recent IPO—but the day-to-day movements of the two securities have remained highly positively correlated.
That relationship raises the importance of today’s earnings report beyond Tesla itself.
A negative post-earnings reaction in TSLA could place additional downside pressure on SPCX ahead of its first earnings report in early August.
As always, the earnings headlines matter—but the market’s reaction to those headlines matters even more. How TSLA behaves around its key support zone will likely provide the clearest indication of whether this consolidation is preparing for another recovery attempt or resolving into a larger decline.
CappNotes offers a small window into the work we do at CappThesis - a technical analysis newsletter company focused on classical chart patterns, trend, and risk management. Explore the full range of CappThesis services here:
Market breadth is most valuable as a measure of participation.
Weak breadth during an uptrend deserves attention, but context matters.
The key question isn't whether breadth weakens.
It's whether it deteriorates alongside liquidity, credit, and earnings.