
Topics covered today include:
Daily Stats
-Key Points
-Data table
-Sectors
-Index breadth
-Best/Worst 20
Market
-Short-term
-Trading Boxes
-Higher Low
-GoNoGo Trend
-Two live bullish patterns
-Potential bullish pattern
Key Charts
-XLU Utilities
-USO Oil
-SIL Silver Miners
-Bitcoin (2)
-Ethereum
Chart Trades
-PGR
-IBM (2)
Key Points
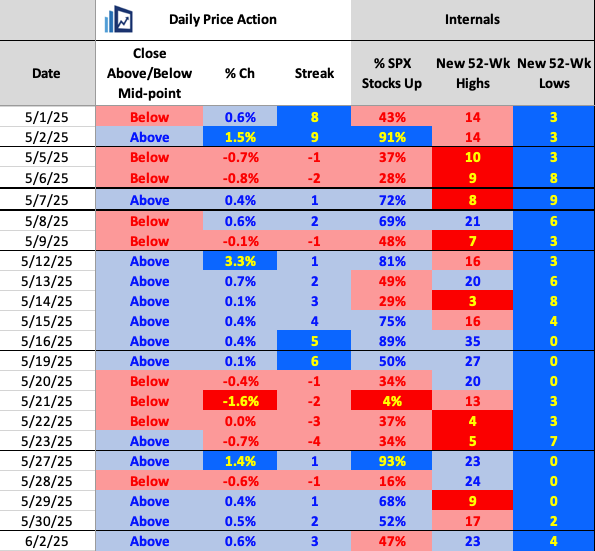
The SPX responded well to early weakness yesterday, pivoted at 10:00 and rode a persistent intra-day bid all the way to 4:00. That amounted to another modest 41 bps gain and close on the highs.
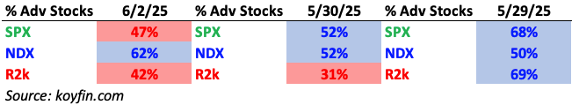
The missing ingredient was positive breadth, though the vast majority of stocks and ETFs and indices were in rallying mode after the first hour of trading. And took a noticeably sub-par adv-dec reading to nearly neutral by the closing bell.
Daily Price Action
The SPX now is up four of five trading days, which has been a solid response to the four-day losing streak from 5/20 – 5/23. The index now has closed above its intra-day midpoint in 11/15 trading days. That’s 73% of the time, which is high and obviously bullish.
Seeing a high frequency of good closes is one the five uptrend traits we look for and track closely every day.
Sectors
Only four sectors had positive internals yesterday, but he negative ratios weren’t terrible for the lagging sectors. Only Industrials had fewer than 30% advancing stocks. Energy led the sectors for the day for the first time since 5/9/25. More on Energy below in the Key Charts section.
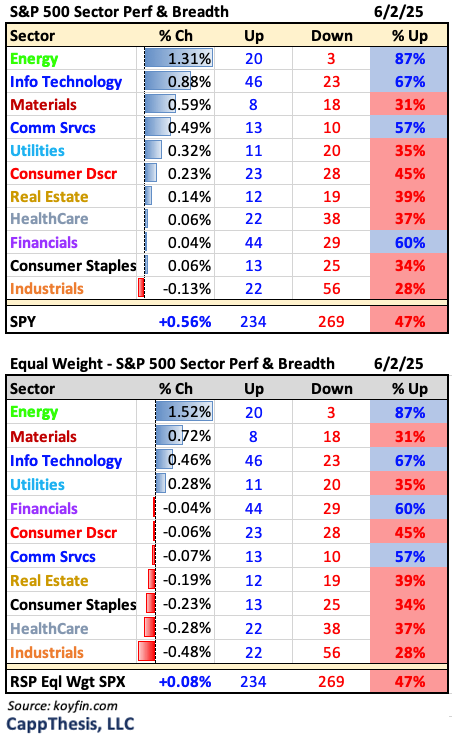
Breadth
The NDX did the best from an index breadth perspective yesterday, as Small Caps lagged.
Best & Worst 20 ETFs
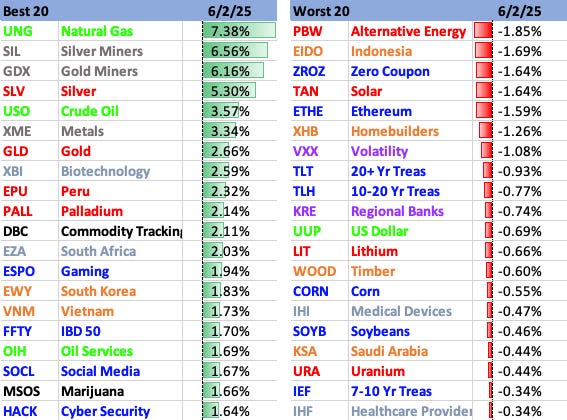
Commodities were the clear leaders on Monday, especially metals. Growth ETFs also were among the leaders, but not from mega-cap. HACK hit a new all-time high.
Short-Term
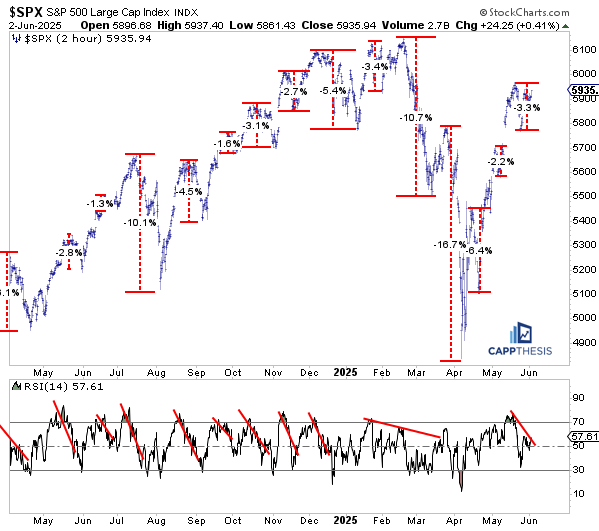
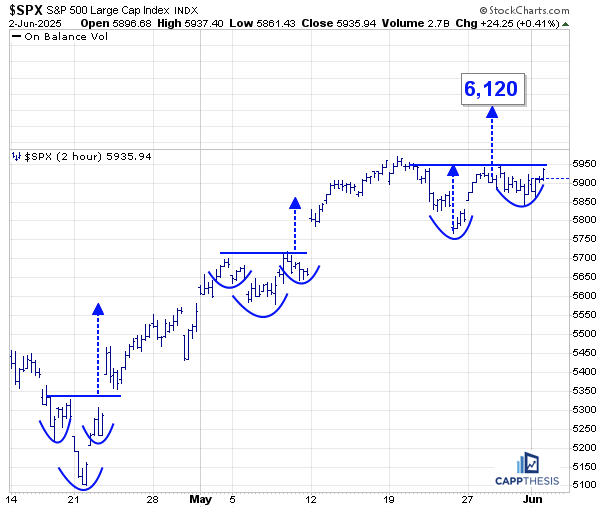
As stated many times, if the SPX is going to continue advancing and ultimately surpass its February and all-time highs, it’s more likely to do so in a steadier, more orderly fashion than what we saw from the April lows through early May. That means the short-term rallies (best viewed on this two-hour chart) will be smaller…
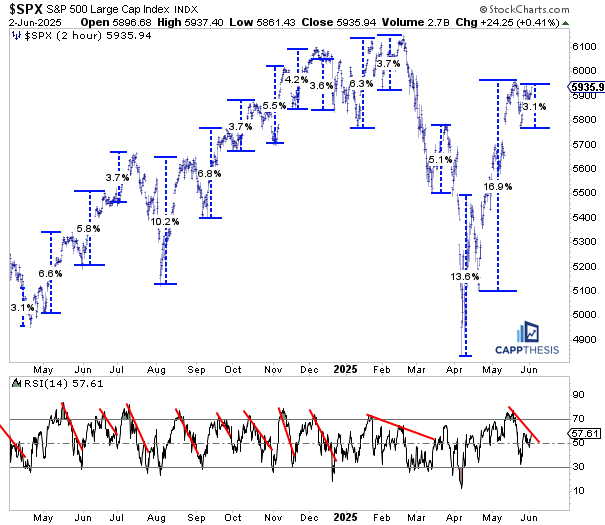
…It also means that the intermittent pullbacks ALSO will be smaller. So, whether the index extends this current 3.1% advance from last week’s low much further or not, it’s more important to see prospective pullbacks continue to create higher lows.
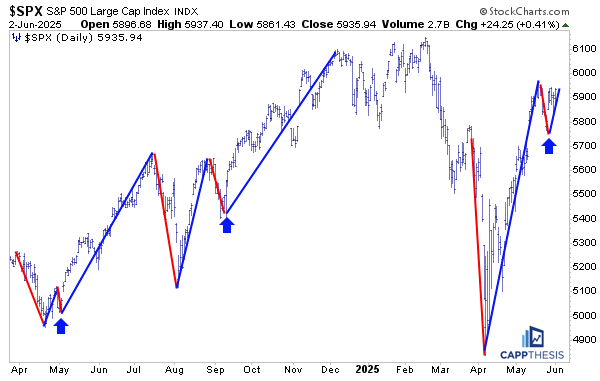
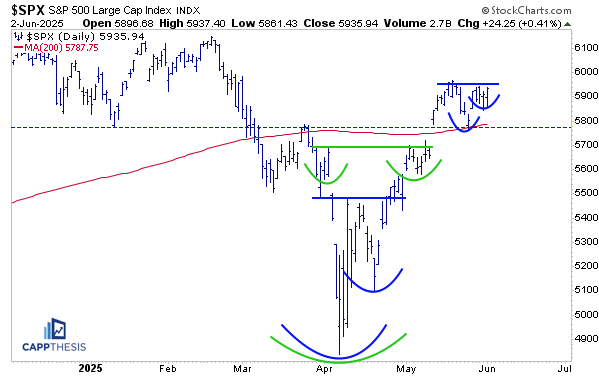
Higher Lows
Speaking of higher lows, here’s an updated chart comparing the recent pullback and bounce to two prior very important periods. The first pullbacks in late April’24 and September’24 were bought. That’s obvious, but the traders who bought that dip continued to buy breakouts and dips in the ensuing weeks and months both times. That made the second legs of those respective upswings noticeably longer than the initial impulsive bounce.
Needless to say, if that happens again this time, it will put the SPX prominently above its February and all-time highs.
Trading Boxes
We haven’t discussed trading boxes lately, but we’ve been keeping track of them since the pivot low. And now, after seeing SPX break BELOW three of the last four trading boxes (red), the index will be trying to break out from its third straight box.
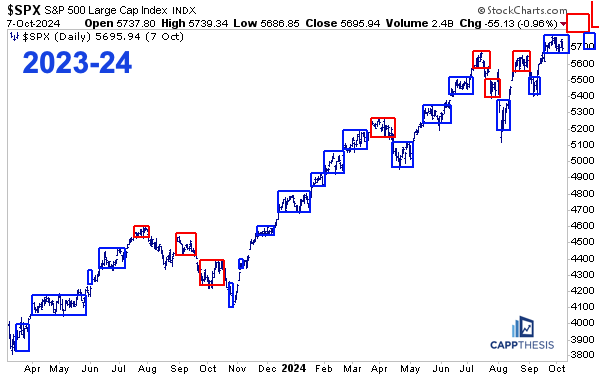
This is an extremely simple concept, but also a very helpful one, especially during low volatile up trending markets…
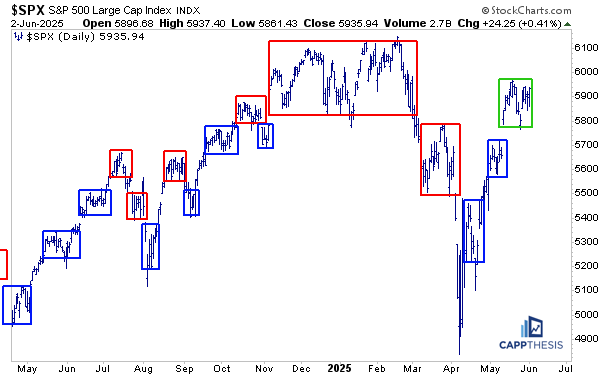
…like what we saw in 2023 and 2024.
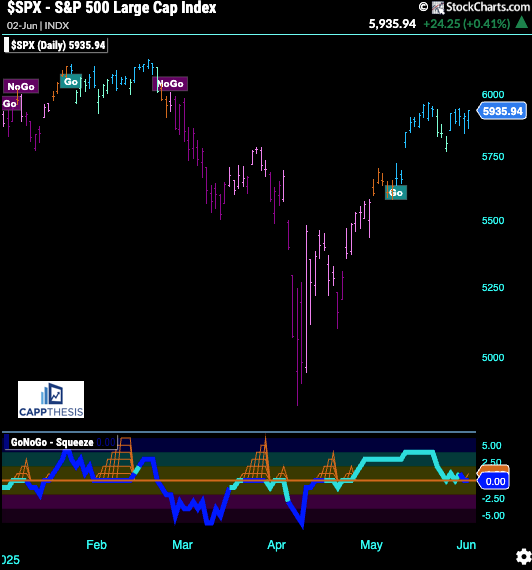
GoNoGo Trend
The SPX remained in a strong bullish trend after yesterday’s advance.
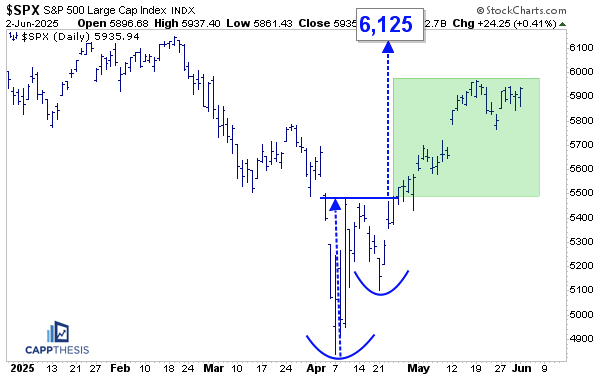
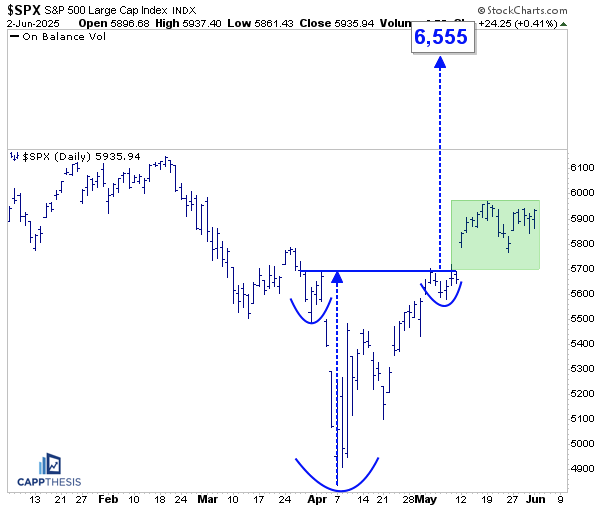
Patterns
The SPX’s two bullish patterns remain in play, with targets of 6,125 and 6,555, respectively.
Potential Bullish Pattern
With yesterday’s comeback, the potential short-term bullish pattern still is a possibility, as well. A breakout above 5,950 would trigger it.
Here all three patterns on the same chart. The obvious difference with the latest one is that it’s taken shape above the 200-DMA.
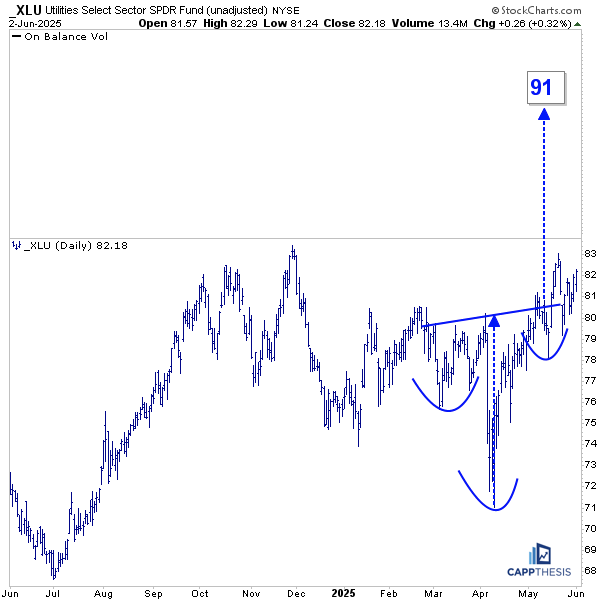
XLU Utilities
XLU is up pre-market off of news. We profiled this potential inverse head & shoulders pattern last Friday. It measures all the way up to 91 should this current breakout attempt hold.
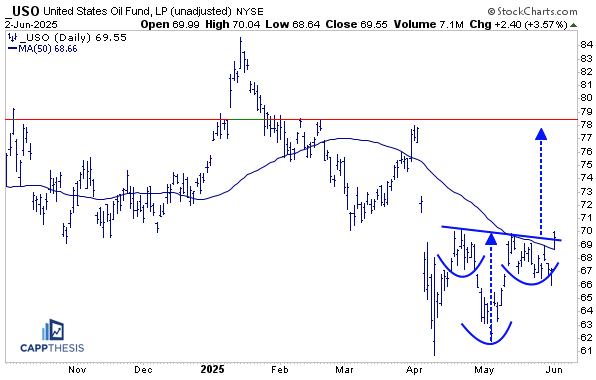
USO Oil
USO was up 3.6% yesterday with Crude Oil rallying. It’s getting closer to breaking out of the potential inverse head & shoulders pattern we profiled last week.
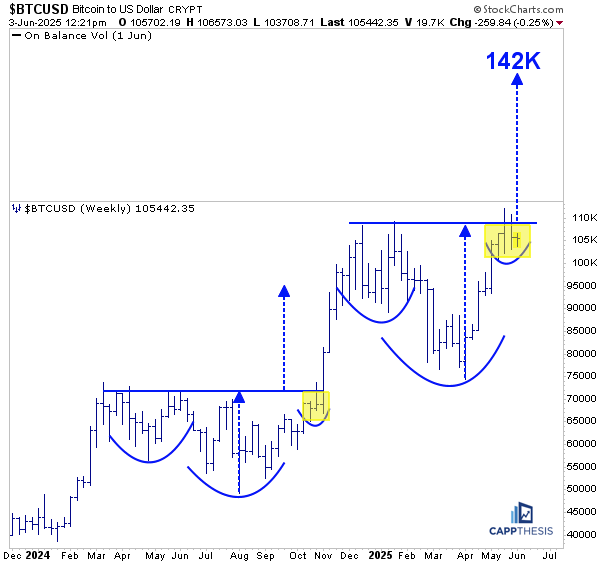
Bitcoin
With Bitcoin failing to hold above 110k, the big bullish pattern breakout is on hold…
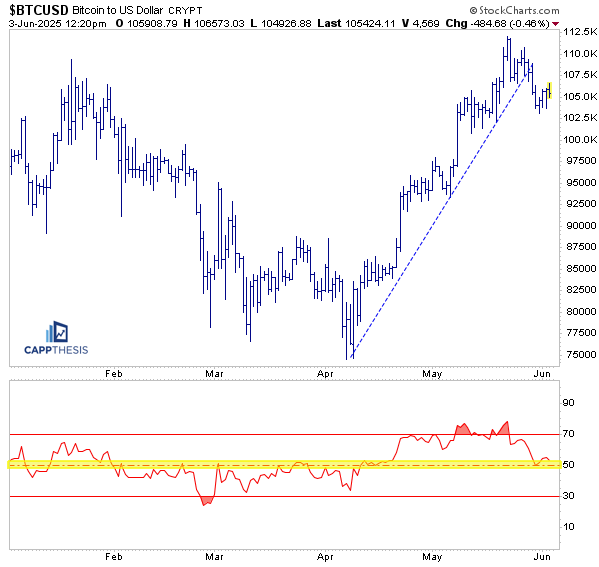
The recent pullback forced BTC below the steep and steady uptrend line that had confined the price action from the April lows through late May.
That was bound to happen at some point, and now it will be important to see its 14-Day RSI respect the 50-zone. It’s crystal clear how momentum can shift to negative and stay that way for months. We last saw that happen from late January through the April low.
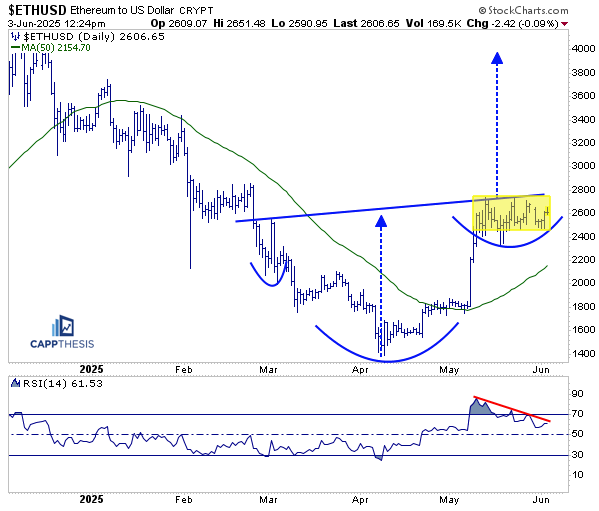
Ethereum
The good news is that Ethereum has held up better over the last week than Bitcoin. But so far, it, too, has yet to break out from what could be a substantial bullish inverse H&S pattern.
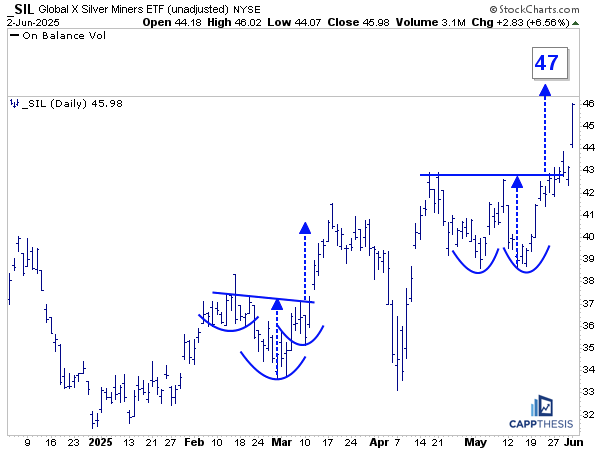
SIL Silver Miners
SIL’s huge day on Monday put it very close to the first of our multiple bullish targets (47).
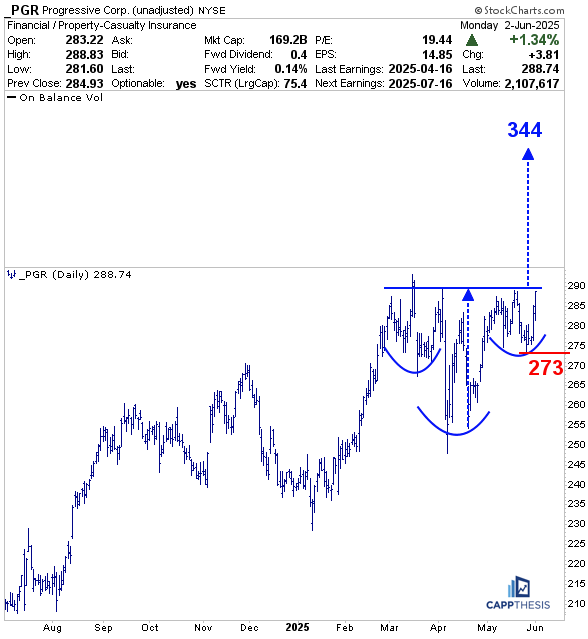
PGR Progressive
PGR has done a good job over the last five weeks digesting its sharp bounce from the April lows, although the price action has been volatile since then. All of that has created this potential inverse H&S pattern. An eventual breakout through the 290-zone would target the 344-area, which would be way above its former March highs.
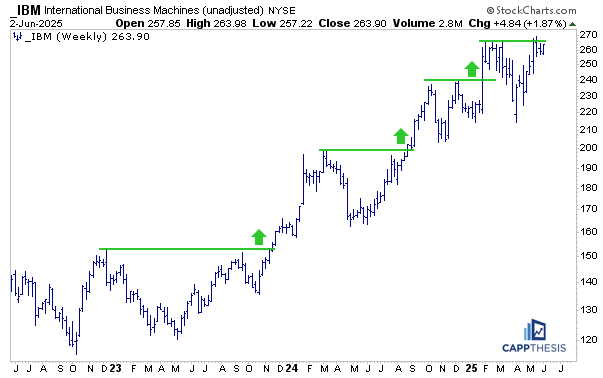
IBM
IBM has formed an inverse H&S pattern of its own since late February. It hit a new all-time high a few weeks ago, but that was quickly faded. With the resultant dip having bought, though, the right shoulder now can be identified.
We’re using the former high points from February and March to draw the neckline from, and a measured move would result in a lofty target near 325. Indeed, IBM would need to overtake the May high (269) first, but the pattern is clear and another leg higher could entice momentum chasers.
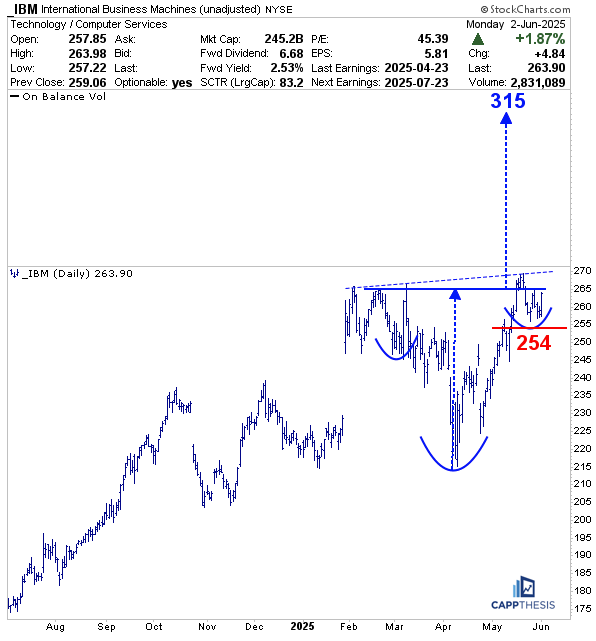
Zooming out, this could be the FOURTH major pattern breakout for IBM since 2023.