


TGIF - Here’s an excerpt from this morning’s Opening Look premium note. Have a great long weekend.
Danger Zone
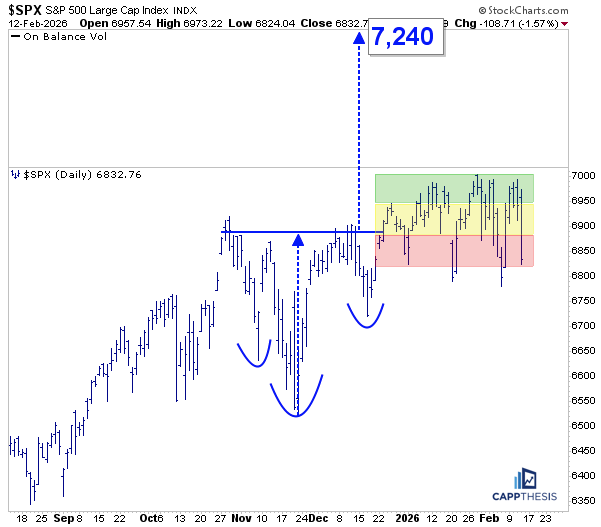
The S&P 500 arguably faces its biggest test yet from a pattern perspective, with the index closing right near the bottom of the danger zone we’ve been tracking for more than six weeks on Thursday.
Indeed, falling back near 6800 is nothing new. We’ve seen it a handful of times since the start of the year, and each time buyers have stepped in. The question now is how much patience traders will continue to have when rallies are rewarded for only a few days and there’s still no follow-through above the key 7000 area.
Yes, 7000 is a round number and carries psychological weight. But more importantly, clearing that level would finally create meaningful separation from the 6080-breakout zone — something the index has failed to do for over a month.
With inflation data on deck and after yesterday’s risk-off action, it’s critical that this zone continues to hold. If we see downside follow-through today or next week, then this pattern would be officially negated.
But as of last night’s close, the target of 7,240 remains in play.
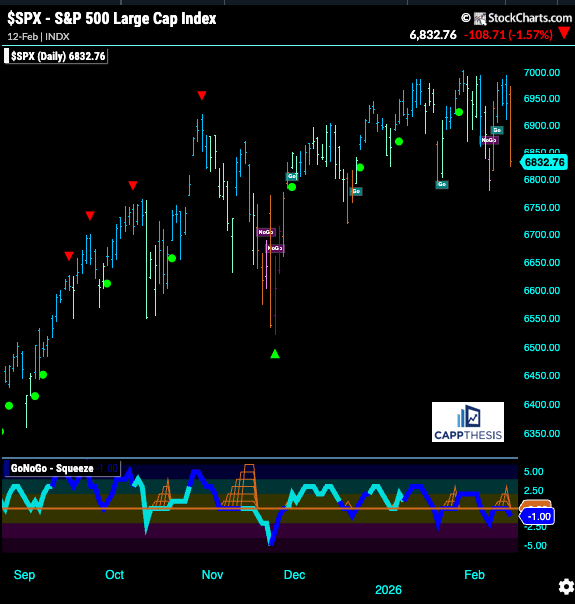
GoNoGo – Back to Neutral
The back-and-forth price movement has continued to push the GoNoGo indicator around, as well, with yesterday’s decline knocking it back into the neutral zone.
On occasion, this can mark an inflection point. We’ve seen this happen a few times already — though it has lasted only a few days before shifting back to GO mode. Thus, we’re closely watching for any change in character this time.
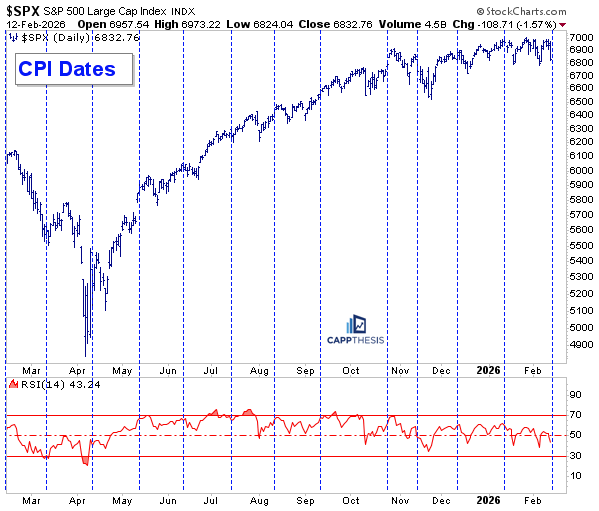
SPX & CPI
Regarding the CPI print, we’ll all be watching for clues about what the Federal Reserve may do in the coming months.
It’s also important to keep the S&P 500’s position in mind. While the index may feel extended and hovering in the danger zone just described, from a pure price-level perspective, it’s essentially in the same spot since the October release – trading roughly between the 6800–7000 range on the day of each of the prior four reports.
For this time to produce a different result, something will need to change in a material way.
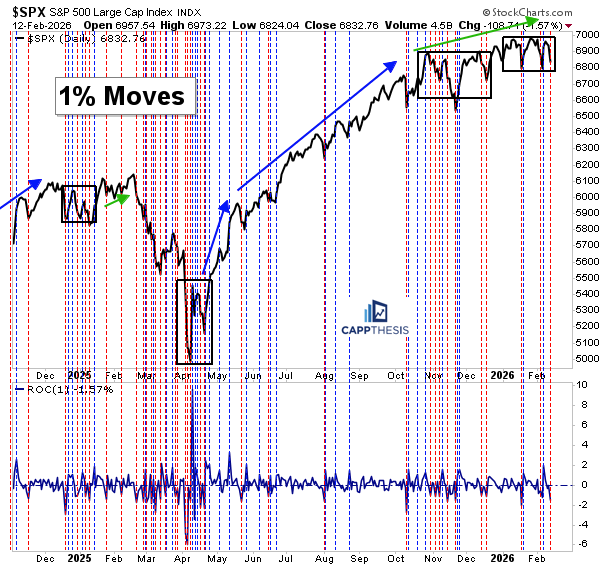
1% moves
As we know, the S&P 500 has followed the last two CPI releases with immediate gains of at least 1%. That was especially emphatic last Friday, when the index rallied 2% after a prior 1.2% decline. Going back to January 20–21, we’ve now seen five 1% moves in roughly three weeks.
That alone isn’t extreme, but it’s now suggesting two-way volatility is returning. And with the index still unable to break out, it raises concern that the recent trading box we’ve discussed could ultimately resolve lower.
This zoomed-in view of the chart we show regularly highlights the biggest volatility events and how the S&P has exited them before transitioning into more consistent advances. We know what happened in April and the historic follow-through that came after. But as the arrows show, the ascent has been losing momentum as time has progressed.
It brings back memories of early 2025, when the S&P was trying to extend from another strong prior uptrend, achieved only a marginal breakout, and then rolled over. The headlines were different — tariffs then versus today’s backdrop — but the price action so far shows a similar type of slowing momentum.
The key difference now has been strong breadth, including repeated clusters of 100+ stocks making new highs. If sentiment continues to wobble, we’ll need that internal strength to persist. It’s close to a perfect storm: if leadership outside of Tech — particularly areas like Financials — starts to roll over, that could become a meaningful concern going forward.
Actionable Charts
The real opportunities are happening in areas outside of the index - both via key ETFs and the individual Chart Trade ideas that we dive into every day.
Let’s get into it…
CappNotes offers a small window into the work we do at CappThesis - a technical analysis newsletter company focused on classical chart patterns, trend, and risk management. Explore the full range of CappThesis services here: