


One of the more interesting features of this market over the last several weeks has been the growing gap between what price is doing and what some of the most widely followed momentum indicators are saying.
On the surface, the S&P 500 continues to hold up well, pressing to marginal new highs and repeatedly testing the psychologically important 7,000 area. Beneath the surface, however, the signals have been more mixed — and that discrepancy is worth unpacking.
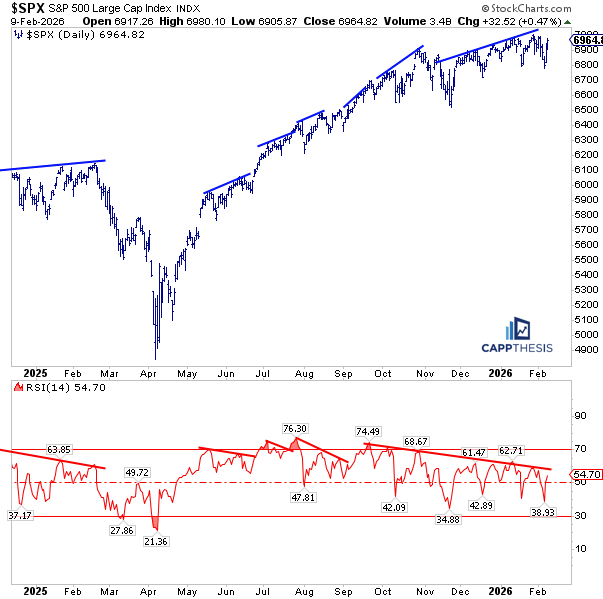
Momentum has been Weakening
The 14-day RSI has been a recurring theme ever since the start of Q4 2025, and for good reason. Despite the S&P 500 making higher highs over the past six weeks, the popular momentum indicator has continued to trace out a pattern of lower highs. The negative divergence has not gone unnoticed, particularly because it has coincided with the market’s inability to convincingly extend from the top of its multi-week trading range.
There’s a straightforward explanation for this.
Until very recently, large-cap growth — and Technology in particular — had been the clear missing ingredient. The S&P 500 has proven it can grind higher on rotation and broad participation for a while, but decisive upside progress usually requires leadership from its largest, most influential components. Without that leadership, momentum indicators like RSI struggle to confirm new price highs.
That said, it’s important not to treat divergences as timing tools in isolation. They are conditions, not triggers. A diverging RSI does not mean price must immediately roll over. Just look how things have played out since last October. It simply tells us that momentum has lagged price — and that gap can resolve in more than one way.
Over the last several months, the market has done an impressive job building a strong foundation outside of Technology. Participation has been broad, and rotation has been orderly rather than destructive. As we discussed yesterday, rotation by definition means capital moving between sectors, not fleeing the market altogether.
Thus, if the pendulum is now swinging back toward Technology, then the RSI divergence could resolve through strength rather than weakness. In other words, momentum can “catch up” to the S&P 500, pushing the RSI back toward overbought territory.
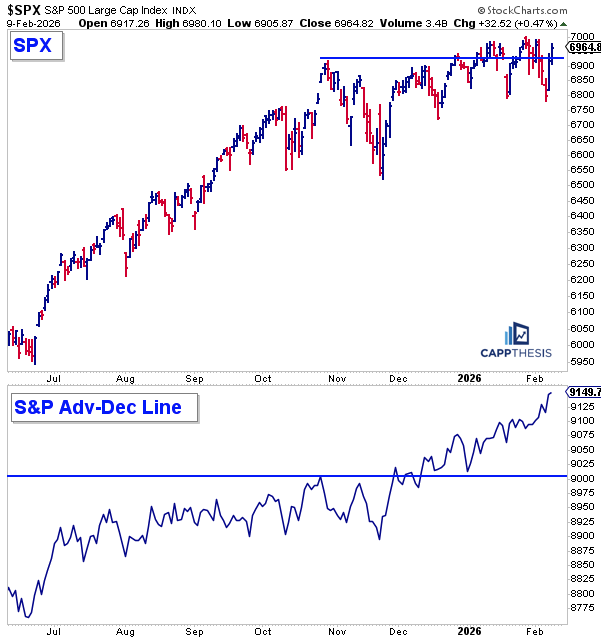
S&P 500 Breadth - Can New Highs Continue?
The worst kept secret is that that market breadth has been historically strong in recent weeks - which is showing a clear positive divergence.
The SPX’s cumulative advance-decline - especially in 2026 - has been nothing short of impressive. Through the first 26 sessions of the year, the S&P 500 has logged positive internals 17 days — a 65%-win rate. On average, 55% of stocks have advanced each session.
When you aggregate that over five-plus weeks, it adds up to roughly 1,275 net advancing stocks. That cumulative progression is exactly what has driven the advance-decline line to repeated new highs and produced the breakout we’re seeing now. This is not subtle strength. It’s a clear signal that the “field” — the average stock — has been participating in the rally.
As we know, this has been the backbone of the S&P 500’s uptrend. It explains why pullbacks have been shallow and short-lived, and why bearish narratives have struggled to gain traction. Markets with weak breadth tend to crack under pressure - see late 2024/early 2025. Markets with strong breadth tend to frustrate skeptics.
The key question going forward is how these two forces interact. Can the field continue to advance if Technology is now set to lead again? What’s notable here is that we’ve now seen two consecutive sessions with positive breadth and Technology leading, a combination that has been surprisingly rare over the last six months.
The Bottom Line
The takeaway is not that one signal is “right” and the other is “wrong.” It’s that we’re at an inflection point where the market is deciding how to resolve these diverging divergences.
If Technology can sustain leadership, momentum indicators like RSI have room to re-accelerate and confirm price. If that happens alongside already-strong breadth, the 7,000 area may prove to be more of a pause than a ceiling.
For now, the evidence still argues for respect rather than complacency. Divergences warn us to stay alert. Breadth reminds us why the trend has been so resilient. How those two resolve in the days and weeks ahead will tell us a lot about the next leg of this market.
CappNotes offers a small window into the work we do at CappThesis - a technical analysis newsletter company focused on classical chart patterns, trend, and risk management. Explore the full range of CappThesis services here:
Thanks as ALWAYS, Frank ‼️🔥🙏
Thank YOU, Luis. Appreciate your feedback always.