


Over the past few weeks, we’ve talked a lot about the technical setup in the S&P 500. Right now, the message from the charts is constructively bullish — but not without caveats.
At the moment:
One bullish pattern is already active.
Two additional bullish patterns are very close to triggering.
That sounds encouraging. However, there’s an important catch.
The S&P 500 has not yet reclaimed its October 27th high. Until that level is decisively cleared, nothing is guaranteed. Technical patterns increase probabilities — they do not offer certainty.
With 2025 nearly in the books, that brings us to the key question every investor is quietly asking:
Do you trust the patterns?
Market Sentiment Is Clearly Bullish
One simple way to understand how investors are feeling is to look at sentiment — essentially, the market’s mood.
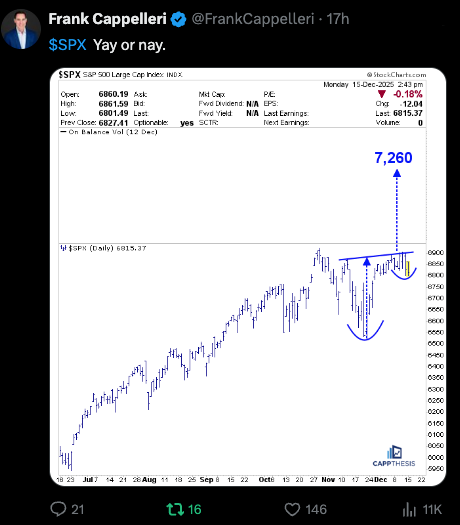
Yesterday afternoon, I asked my X followers whether they were bullish or bearish and showed this chart.
The response was strong and engagement was high.
As of 7:30 AM this morning, the results were:
13 bullish responses (Yay)
3 bearish responses (Nay)
That’s a clear bullish skew.
Is it a small sample size? Absolutely. But even small samples can still reflect the broader mindset of market participants — and right now, that mindset is optimistic.
Why This Bullish Bias Isn’t Surprising
The optimism we’re seeing didn’t come out of nowhere. There are a few very logical reasons behind it.
1. Recency Bias Is at Work
The market has been rebounding. When prices move higher, investors naturally start to feel better.
This, of course, is known as recency bias — we tend to place more weight on what has happened most recently and assume it will continue. Rising prices reinforce confidence, even if longer-term risks still exist.
2. Most Investors Are Long-Term Participants
The majority of market participants are not professional money managers. Most people:
Invest steadily over time
Do not believe they can consistently beat the market
Expect that staying invested will pay off in the long run
Because of this, pullbacks are often viewed as temporary setbacks rather than reasons to abandon positions. Hope and patience tend to dominate decision-making, especially when prices are moving higher.
Seasonality Adds Another Bullish Tailwind
Another reason sentiment is leaning bullish has to do with seasonality.
Seasonal market studies — especially those highlighting strength in the second half of December — are widely shared and easy to find on platforms like X. Most investors are well aware of them.
And for good reason.
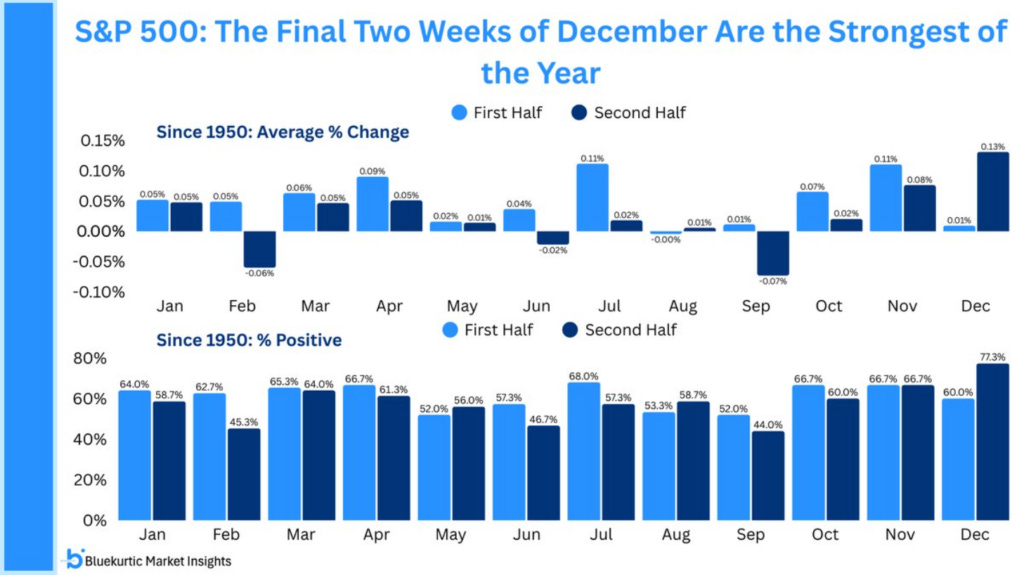
Historically, the second half of December has been one of the strongest periods of the year. In many seasonal charts:
The second half of each month is shaded in dark blue
December consistently stands out as the strongest month
This history creates a built-in expectation that markets should perform well during this period.
Of course, markets don’t move simply because a calendar tells them to. Seasonality is not a guarantee — but it does influence psychology and positioning.
When Multiple Bullish Signals Align
Here’s where things get interesting.
If the seasonal tailwind shows up at the same time that:
The S&P 500 confirms its existing bullish pattern
The two pending bullish setups trigger
Then the market would be benefiting from multiple bullish forces aligning at once — price patterns, sentiment, and seasonality all pointing in the same direction.
That kind of alignment doesn’t ensure higher prices, but historically it has improved the odds.
The Bottom Line
Right now, the market is sending a cautiously optimistic message:
Sentiment is bullish
Seasonal trends are supportive
Technical patterns are close to confirmation
But until key resistance levels are reclaimed, discipline matters.
The real question isn’t whether the patterns look good — they do.
The real question is whether you trust them enough to follow your process, manage risk, and let the market prove itself.
As always, we’ll let price — not hope — be the final judge.