Also - here’s an interview I did with CNBC this morning.
Key Points
The SPX logged its 12th absolute 1% move of March on Friday; its eighth 1% decline and its second two percent loss, as well. For some perspective, the index endured more than eight 1% losses in a calendar month just once in 2022: September (9). It had more than 12 absolute 1% moves three times: June & September (13) and March (14). The trend continues…
All of this has created a challenging environment—no matter what timeframe you’re looking at on the charts. We’ll be going through some of the short-term, intermediate, and longer-term charts today.
Moving Averages, Anchored VWAPs
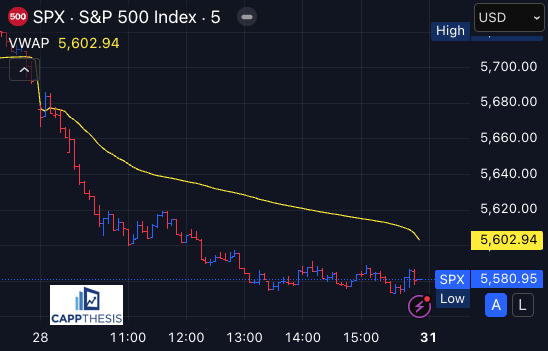
First, the SPX has finally dropped back below the anchored VWAP line tied to the March 13 low. With this decline, it’s now also below several other key lines: the 200-day moving average, 20-day moving average, 5-day moving average, and the anchored VWAP from the February 19 high. All of these now are key resistance as we wrap up March and head into the second quarter.
Short-term
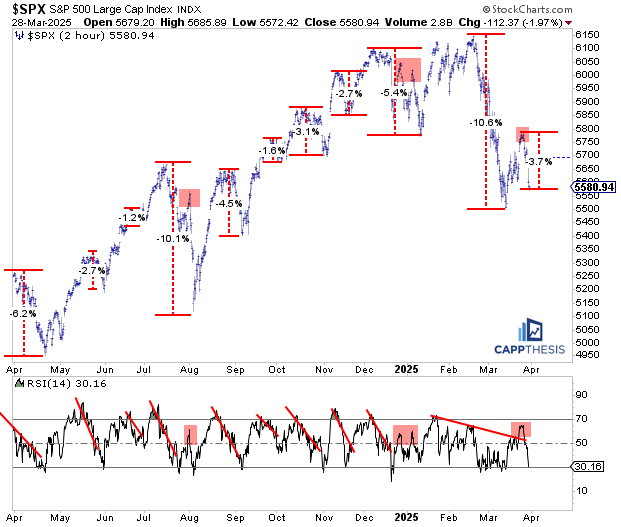
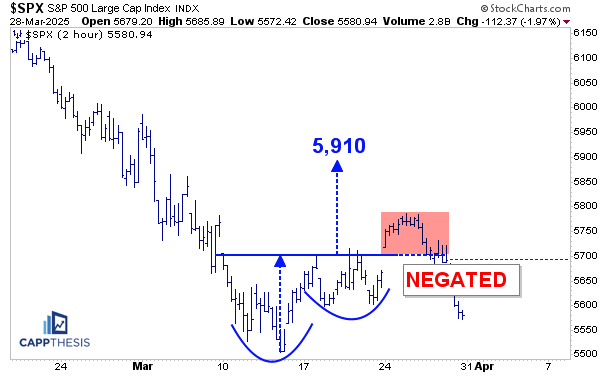
Looking at the short-term 2-hour chart, it’s clear that the most recent decline now has pulled the 14-period RSI back down into oversold territory. That’s important to recognize because during the preceding advance—even though the S&P rallied nearly 5%—the RSI never made it back into overbought territory.
As we’ve highlighted recently when snapback rallies aren’t strong enough to push even the shortest-term indicators back above 70, it often leads to further downside and additional down legs—something we’ve seen play since last summer – see the red highlights.
This shows how a simple snapback can’t change the market’s complexion without real follow through – something we got very accustomed to seeing in 2024 and now has been missing in 2025.
MACD
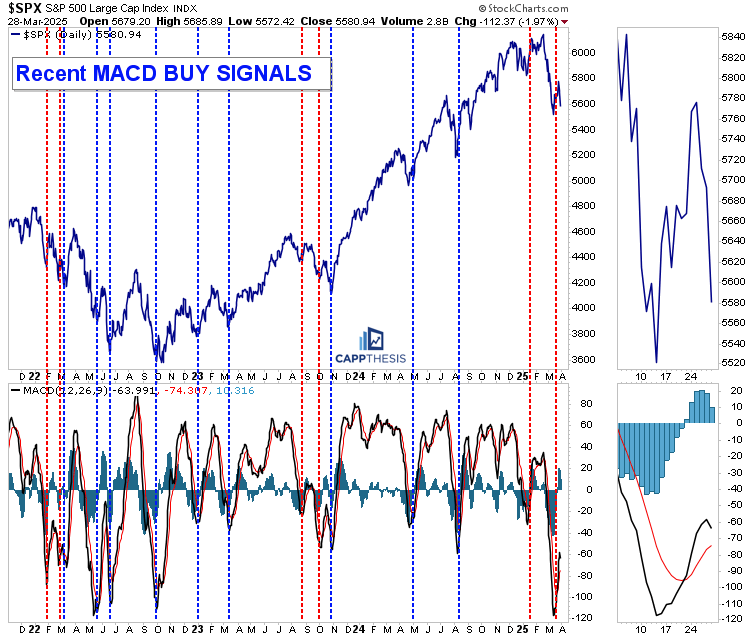
Turning to the MACD indicator, the buy signal that was triggered early last week has NOT played out. If this weakness continues for even another day or two, that signal could be completely voided (if the black, faster line undercuts the red line).
Looking at the chart, it’s also clear this now is the second straight failed MACD buy signal. The last time we saw that was during the August to October 2023 correction, when the S&P dropped 11%. It took a third buy signal in early November before we got one that actually worked.
That’s important because – as we’ve reviewed in the past—even during the 2022 bear market, MACD buy signals worked. When they triggered back then, most led to stronger and longer bear market rallies – a lot better than the ~5% pop we just saw over the past week and a half.
Weekly Channel
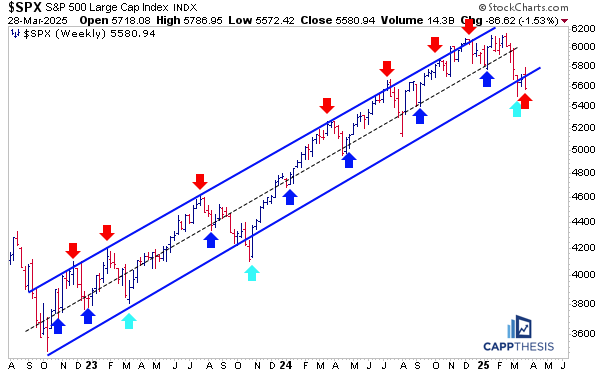
Turning to the weekly charts, the S&P 500 is now starting the week—and ending March—below the lower threshold of the major trading channel. The attempt to reclaim that line clearly failed, and this is now the longest stretch the index has spent below it since October 2023.
Of course, that time was different—the stay below the channel on a closing basis was brief and led to NINE straight up-weeks. This time, the initial rally attempt has failed. And with the market starting today in the red again, we’re drifting even further below the channel.
Should this continue, this structure may be voided entirely soon. This is significant given how well the channel contained price action over the last two-plus years.
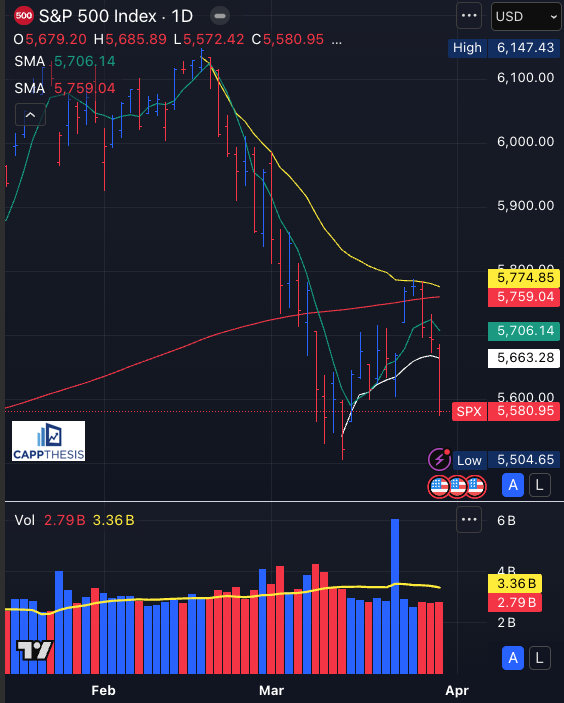
Weekly Moving Averages
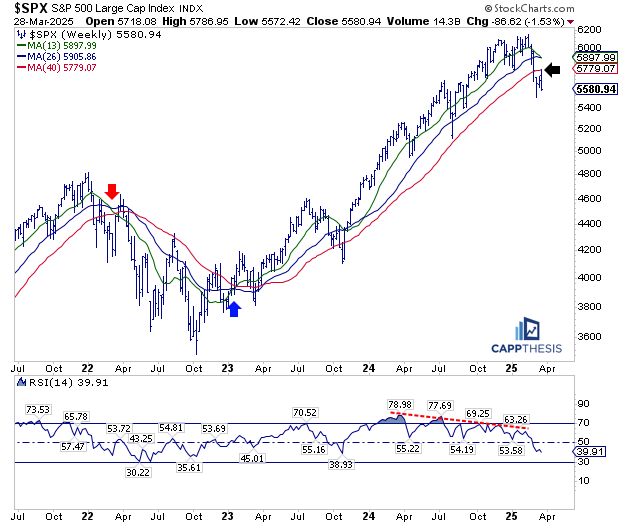
Looking at the weekly moving averages, the S&P continues to trade below all three—and as we can see from the chart, they’re now starting to roll over as well. The concern, once again, is that this continues to resemble the early stages of the 2022 bear market, where those same lines lost strength, rolled over, and eventually became clear resistance.
Back then, the S&P made several attempts to rally—some of the strongest bear market rallies we’ve seen—but they failed to change the overall complexion. It wasn’t until well after the ultimate low was in that the picture truly began to shift.
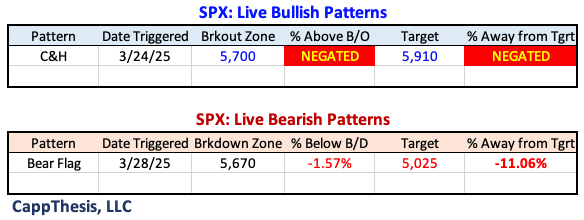
With the S&P slicing through 5,700 early in the day, the latest bullish pattern was negated. This one, from the 2-hour timeframe, had an upside target of 5,910. This is now the fifth straight failed bullish pattern since December. That’s a sharp contrast to the 11 consecutive successful bullish patterns we saw play out from October 2023 through December 2024.
At this point, the trend is undeniable: bullish patterns are not working. As we all know by now, the SPX needs successful bullish patterns to be in an uptrend.
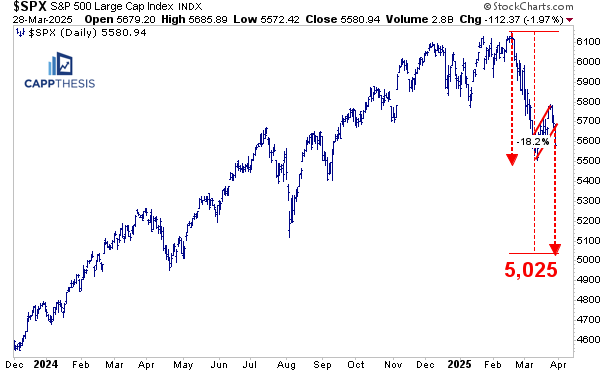
The decline also triggered the bearish pattern—the bear flag that we’ve been watching – its measured move is considerably lower. Measured moves from bear flags are calculated by taking the height of the preceding flagpole and then subtracting that number from the breakdown zone, which in this case is around 5,670. That gives us a downside target near 5,025.
Clearly, that’s a big move. Of course, we expect other patterns to develop along the way, even if we do eventually work our way down to the 5,000 zone. We’ll continue to keep this one on the radar as long as it remains valid.
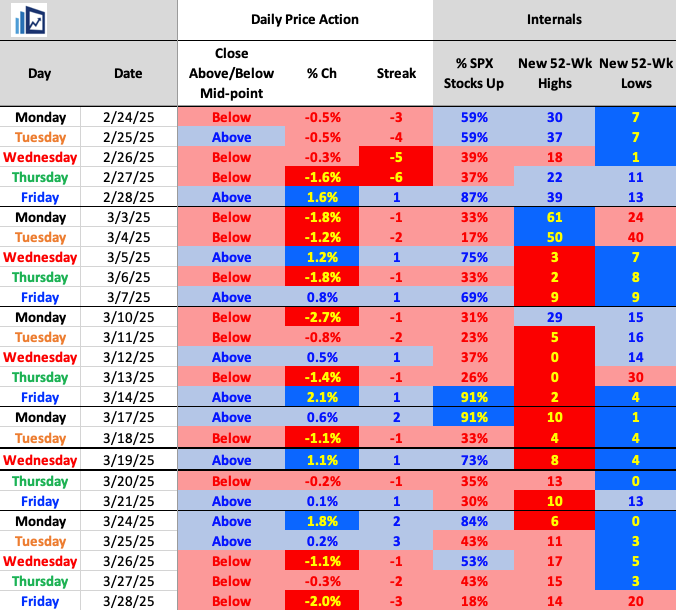
Daily Price Action
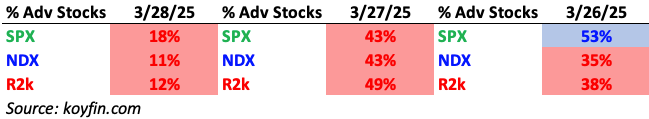
The 18% advancing stocks on Friday was the least since 17% from March 4th.
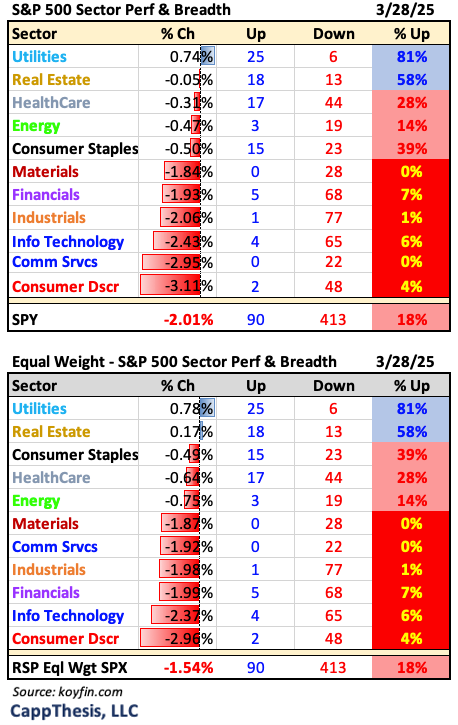
Sectors
It was more of the same from a sector perspective on Friday, as well – large cap growth lagging and safe haven leading.
Breadth
It was one of the aggregate worst breadth days of the month on Friday, as well.
Best and Worst 20 ETFs
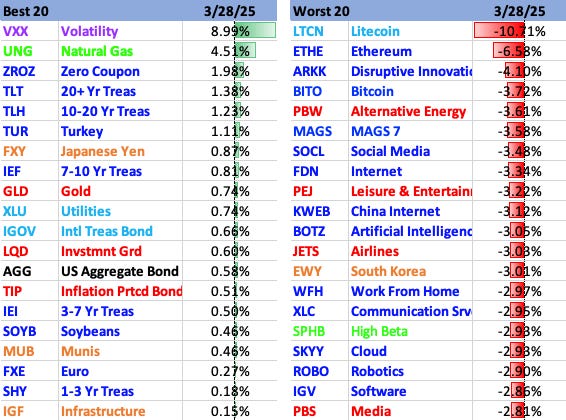
The March 28 snapshot highlights a clear risk-off rotation, with leadership concentrated in volatility, long-duration Treasuries, gold, and utilities, signaling a defensive shift in positioning.
On the flip side, crypto, disruptive tech, and AI/growth ETFs dominate the laggards, confirming broad-based selling pressure in speculative risk assets.
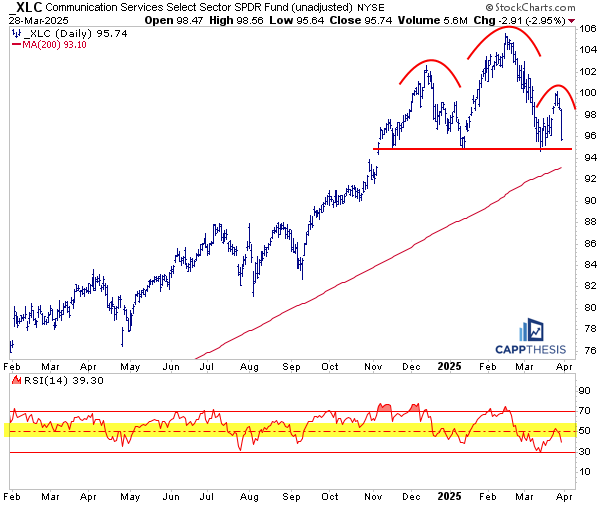
XLC Communications Services
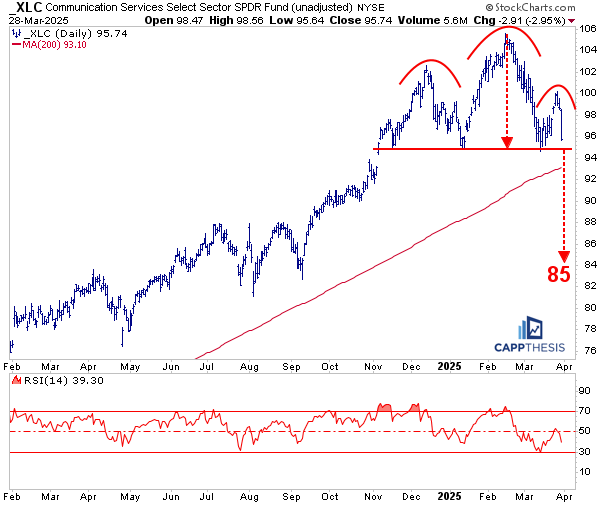
With the big drop on Friday, the XLC Communications ETF is now very close to completing a clear bearish head and shoulders pattern. If we get a confirmed downside break that holds through today’s close, the pattern a target 85, based on the measured move from the recent high…
If that target is hit, it would mark about a 20% decline—a substantial move. That said, as readers know, we’re always cautious about declaring big patterns like this “successful” right away, especially when there’s already been significant preceding weakness. These setups can sometimes result in bear traps, with a quick downside break that gets aggressively bought.
The worst-case scenario would be a clean downside break, followed by a weak bounce that fails at resistance, which would open the door to a deeper down leg.
Looking beyond this, keep in mind that in 3–4 weeks, mega-cap growth stocks will begin to report earnings. Many of them would be in a very different spots on their charts compared to where they were last earnings season in January. At that point, they could look a lot more enticing to traders – at least from a price level point of view. It will take a while for bullish patterns to form again.
But for now, we’ll see if there’s a breakdown, how long it lasts and if there’s any rally back up toward the neckline.
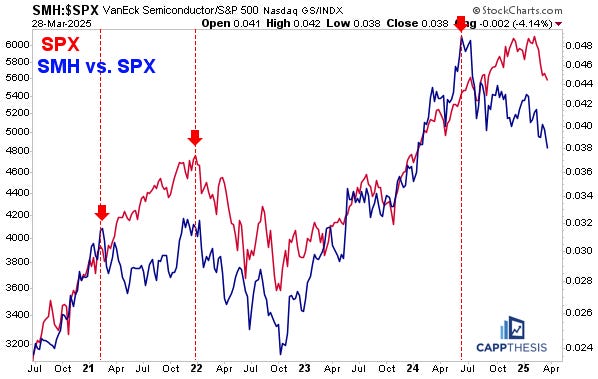
SMH vs. SPX
We’ve shown this chart before—and here’s how it’s progressed in recent weeks. No surprises, but it’s clear: when SMH underperforms SPX, the broader market struggles. This relationship wasn’t obvious right away in the second half of 2024. But as the SMH/SPX relative line continues to weaken, it’s dragged a lot of other areas lower with it.
The same dynamic has held on the upside—something we shouldn’t forget when the time comes again.
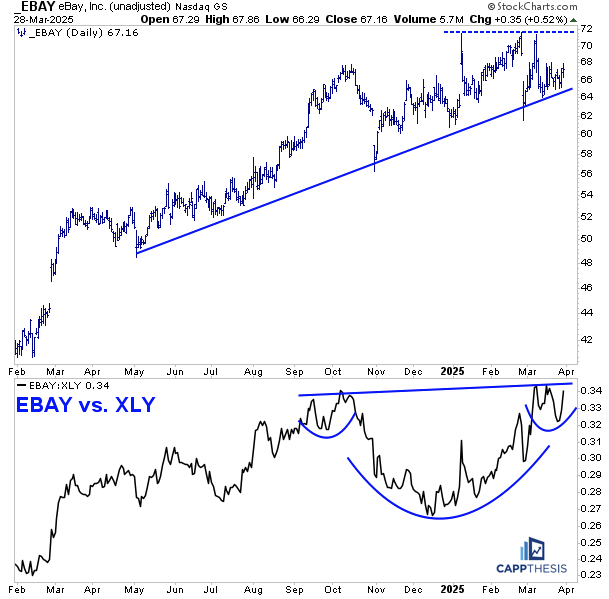
EBAY
EBAY was just one of two Consumer Discretionary stocks that logged a gain last Friday. It also remains in an uptrend—a rare feat for any U.S.-based equity these days, especially one that’s considered a growth stock. Since last October, it’s bounced back strongly from two post-earnings downside gaps, including the most recent in February.
This relative strength has helped EBAY outperform the XLY ETF since mid-December, with the EBAY/XLY ratio chart now pushing toward a breakout to new 52-week highs.
There’s still work to do before reclaiming the highs just below 72, but if the broader market finds its footing soon, EBAY could very well make another run at that potential breakout zone. For the setup to stay intact, holding above the 61–62 support area is key. The 200-day moving average is right there too.