

Five Key Charts
Focus areas to conclude another epic month

TGIF. First, here’s a video walkthrough I recorded of an Opening Look piece from earlier this week.
This morning, we sent clients a new Chart Rundown featuring 25 key charts. I intentionally use different chart setups, often on familiar symbols, to keep the analysis fresh and ensure we’re evaluating the market from multiple angles.
Below are a few examples from today’s piece.
Have a great weekend.
DIA – Extending
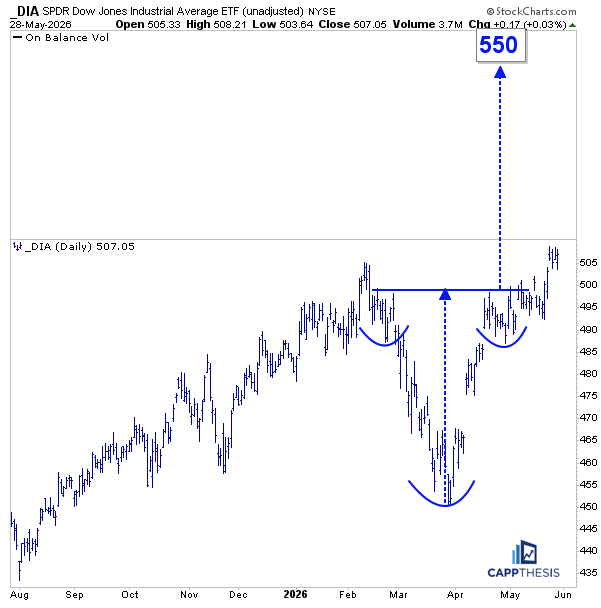
The DIA’s bullish inverse head-and-shoulders pattern breakout has extended this week, with the upside target sitting noticeably higher at 550.
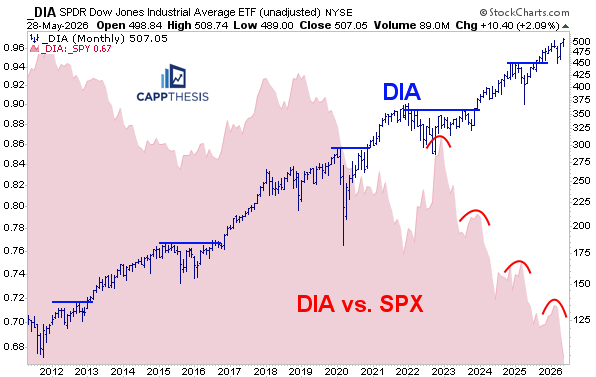
DIA vs. SPX
That said, the DIA remains in a distinct downtrend vs. the SPX, making another new relative low vs. the index low this month.
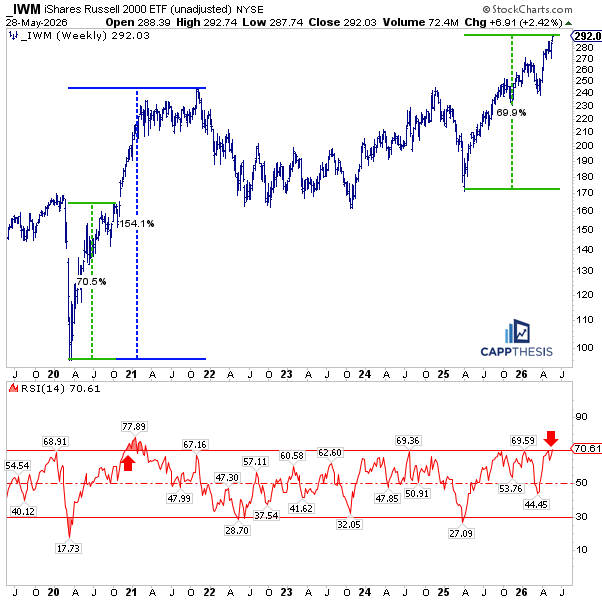
IWM R2k – 2025-2026 vs. 2020-21
IWM is now up 70% from its 2025 low and has pushed back into weekly overbought territory. That sounds like a lot, but it pales in comparison to the 2020-21 advance, which ultimately ran roughly +150%.
Highlighted in green in 2020 is the point where IWM had also gained 70% and first reached weekly overbought — which turned out to be the middle of that entire run.
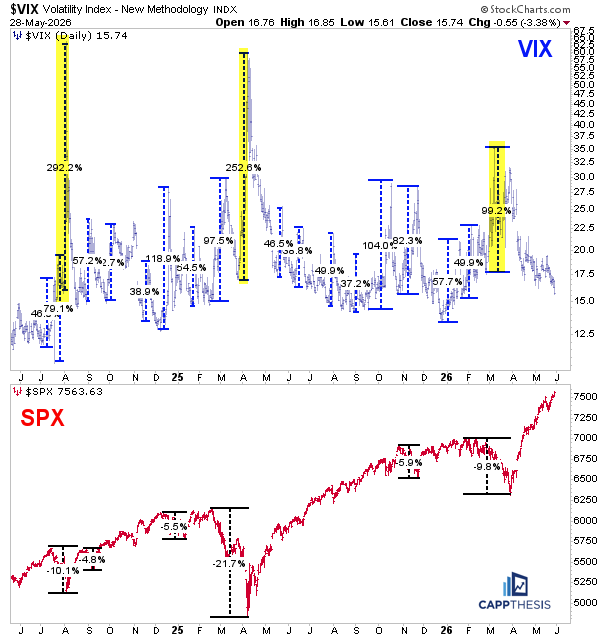
VIX – Still falling but watch it closely
The VIX made another new multi-week low yesterday and continues to confirm the SPX’s upswing.
And even though the biggest VIX spikes over the last two years coincided with the worst SPX sell-offs, there have been more than a dozen large VIX moves where the SPX only marginally sold off. Let’s not rule out that happening again at some point soon.
XLK Tech - Two huge months
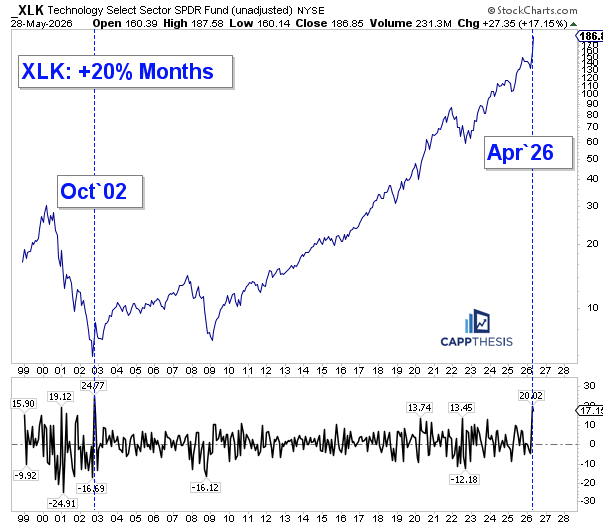
XLK is up 17% in May after gaining 20% in April, which was only its second 20% month in history (the other was October 2002).
XLK – Trading Channel
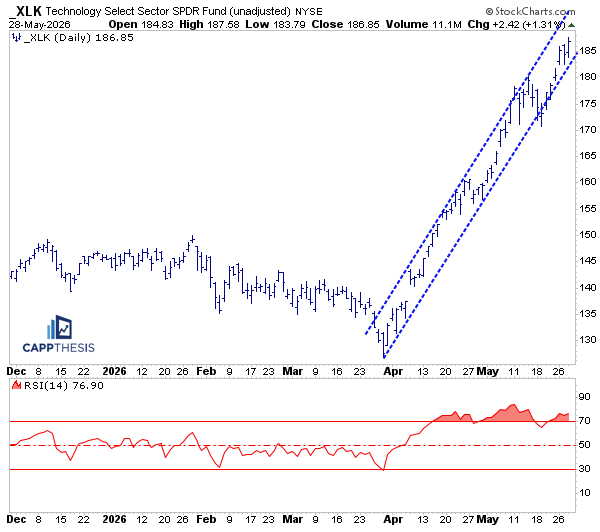
Not only has XLK‘s performance been remarkable, its adherence to this steep and tight trading channel has been equally striking.
ARKK – Key Test
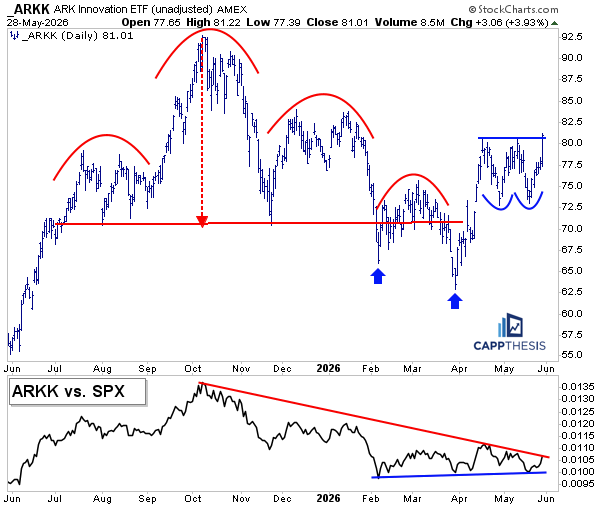
ARKK ripped nearly 4% higher yesterday and is now poking above key resistance near the 81–zone, which had failed twice prior over the last six weeks.
This is a classic example of how a big failed bearish pattern can give way to a strong bounce and potentially much higher prices. The ARKK/SPX ratio line is also close to breaking through a key downtrend line...
CappNotes offers a small window into the work we do at CappThesis - a technical analysis newsletter company focused on classical chart patterns, trend, and risk management. Explore the full range of CappThesis services here: