

Hovering
This morning we took a close look at the SPX's short-term setup, broke down key growth ETFs, and discussed FOUR trade ideas

Short-term Rallies
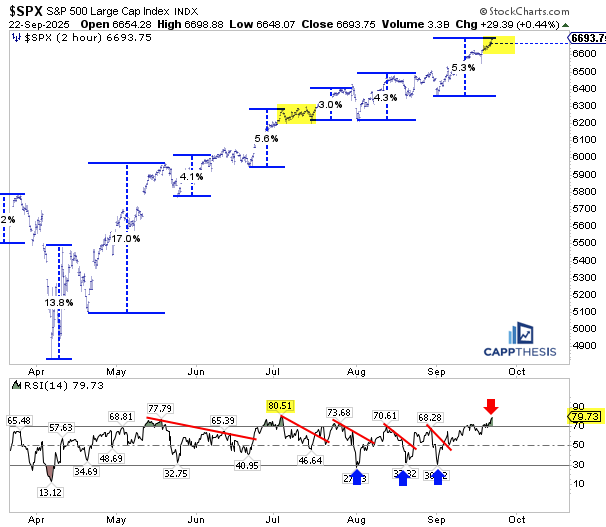
Here’s a fresh look at the short-term S&P 500 chart. This is the 2-hour timeframe with the 14-period RSI in the bottom panel.
The trough-to-peak advance from the August 31 low now measures +5.3%—the fourth largest short-term rally since the lows, and the second largest since May.
This surge also pushed the 14-RSI to nearly 80 (as marked by the red arrow), its highest closing level since early July, when it briefly touched 80.5.
This parallel is notable because in July the S&P 500 logged no 1% daily gains or losses—the first such month since December 2019. Now, with just six trading days left in September, the index is doing the same thing: no 1% moves so far.
So the question is: with a short-term +5% surge and a stretched RSI, can the market once again digest this bout of congestion constructively—just as it did in July?
SPX & Bitcoin
One key difference between September and July so far is that Bitcoin has recently pulled back. Up until the last few days, both Bitcoin and the S&P 500 had been having strong months. Of course, Bitcoin is far more volatile, so it can recover quickly (from what would otherwise be considered a substantial pullback if it happened to an equity index).
We highlight this because Bitcoin has not played much of a leadership role in months. The last time it veered from the SPX was at the beginning of the year, Bitcoin’s stall and pullback eventually led to a similar scenario in the S&P 500. Of course, both then rolled over together during the “tariff tantrum” in March and April.
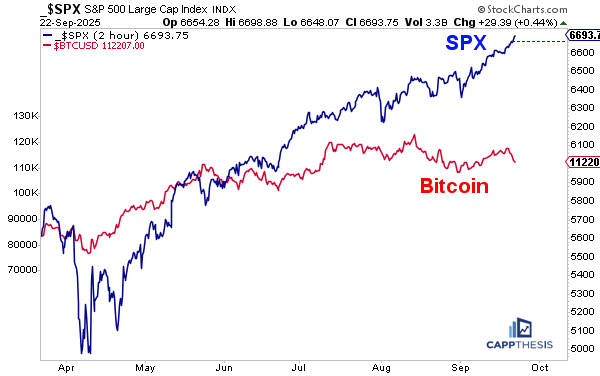
While conditions are different this time, it’s important to note when Bitcoin and the S&P 500 diverge. That’s a condition that rarely lasts long. Thus, right now, either Bitcoin catches up to the upside, or the S&P 500 rolls over. With the index already extended from nearly every angle, the concern is the latter.
For now, momentum doesn’t suggest an imminent rollover. That would change the picture is if the next dip isn’t bought.
More importantly, if the dip IS bought but it then produces a lower high, it would mark the early stages of a bearish pattern—something we’ve seen only sparingly since the market bottomed in April.
GoNoGo Trend – Daily
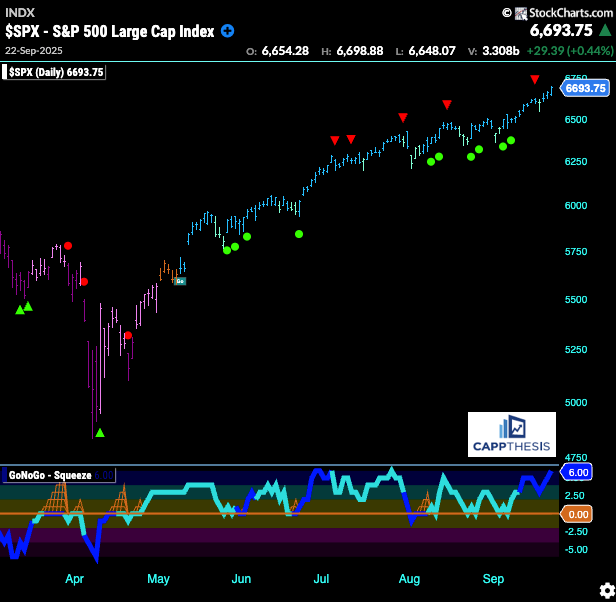
The GoNoGo indicator remains in a bullish trend. So far, the latest counter-trend signal (red arrow) has yet to result in a bigger downturn. The past iterations all led to pauses, as well, but none of the pullbacks have been overly damaging up to this point.
Live Bullish Patterns
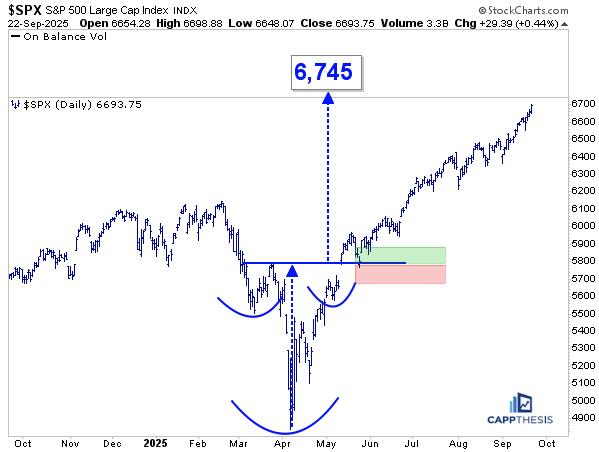
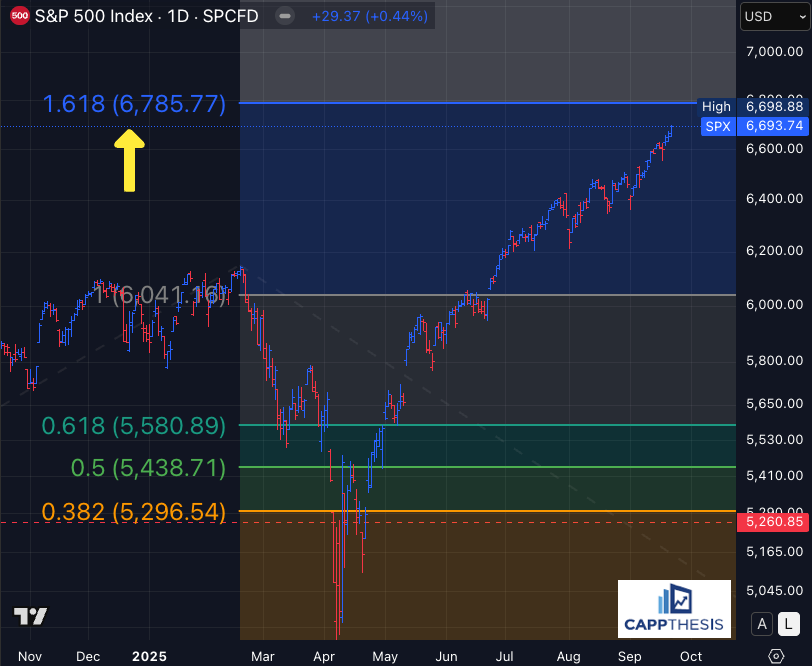
With the 6,665-target hit last week, we’re left with one live bullish pattern. The largest, in place since 5/12/25, carries a target of 6,745—now just 77 bps away as of last night’s close.
Fibonacci Extension Target
As noted yesterday, the 161.8% Fibonacci extension is slightly higher at 6,785.
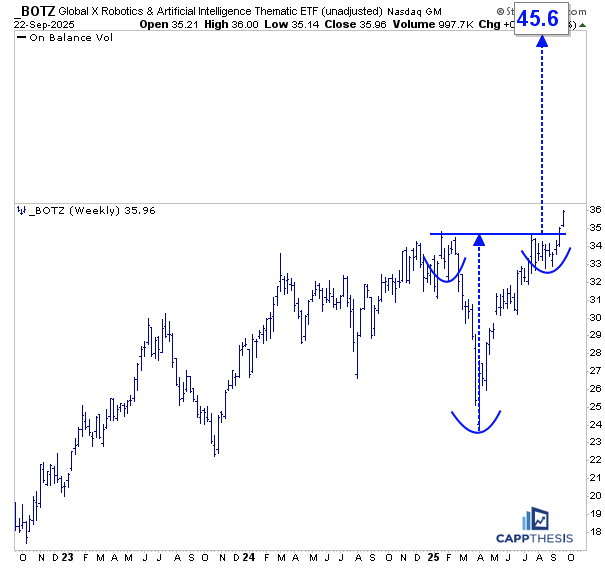
BOTZ – Robotics & AI
BOTZ had a strong move yesterday, emerging as one of the leaders on our list. This surge followed last week’s marginal pattern breakout, which is now much more clearly established on the chart below.
Importantly, BOTZ is just the latest growth-oriented ETF to break out, with several others already doing so earlier this year. Given the sharp downside the ETF experienced earlier this year, this move sets up a substantial upside target near 45.6.
As with any breakout, it should be respected while in play but treated tentatively until follow-through confirms its strength.
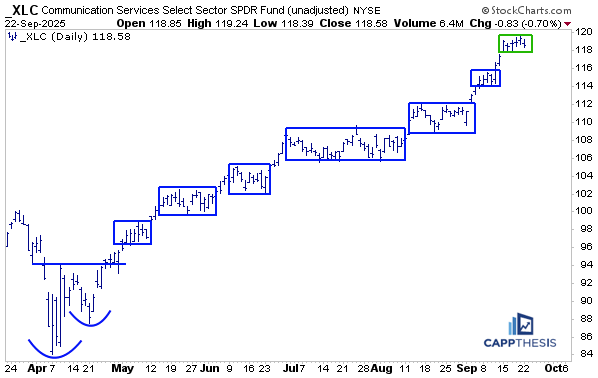
XLC Comm Services
XLC Communication Services ETF has been in a textbook staircase-like advance since the April lows. We’ve been highlighting each of these trading boxes in real time, and XLC has now broken out of six consecutive boxes. With the latest push higher over the past two weeks, it has now formed a seventh trading box.
Of course, these boxes can’t last forever—eventually, one will mark a reversal. But trying to anticipate that outcome over the past several months, without any evidence of support breaking, would have been the wrong approach.
For now, we continue to recognize that the uptrend remains strong. And in strong trends, consolidations—whether framed as trading boxes or classical continuation patterns—tend to be digested and resolved to the upside.
SMH Semis
It’s been a similar ride for the SMH Semiconductor ETF, though with fewer trading boxes in play compared to XLC. The most recent box was the largest, and at the time we discussed that consolidation as a potential topping formation.
Instead, it proved to be digestive in nature, holding firm above the 280 area, which never saw a decisive downside break. The subsequent bounce was extremely strong, eventually leading to the early-September breakout—and more recently, a much larger surge over the past few days.
From this perspective, the best-case scenario would be another bout of sideways consolidation that ultimately resolves higher.
As we’ve shown in recent weeks, the weekly upside target remains up at 330, and the current comeback still resembles the pattern we saw in 2020–2021. If that analog continues to play out, SMH, obviously, could have much higher prices ahead.
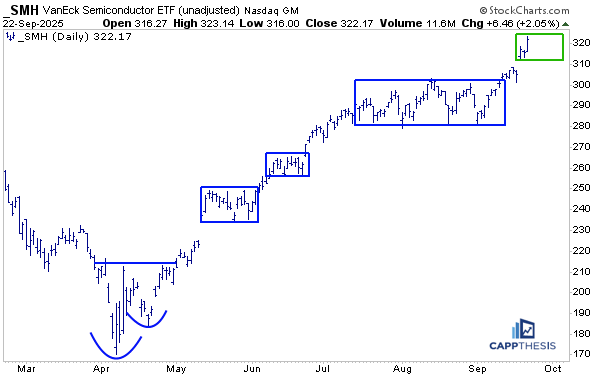
Chart Trades
Needless to say, for SMH to continue higher, its holdings must also extend their rallies. We reviewed three key semiconductors—plus a non-tech name showing major turnaround potential with considerable upside for premium CappThesis clients pre-market this morning.