

Key Levels
While both bulls and bears have made daily attempts to grab momentum, no one’s walking away satisfied... yet.

Here’s an excerpt from today’s Opening Look - a daily pre-market strategy note, analyzing the major asset classes, indices and ETFs, with studies and Chart Trades – stock trade ideas with specific entry and exit levels.
With the market violently zigzagging over the last few weeks, a number of price levels have come into play. The SPX sliced through plenty of potential “key levels” on the way down, but since mid-March, some buy-side interest has finally emerged. And since then, neither side has held a clear edge—no matter what they say.
Since the close on Friday, 3/10, the SPX is up just 19 points over 16 trading days. Ironically, the index has logged seven absolute moves over that stretch — three up, four down.
So, while both bulls and bears have made daily attempts to grab momentum, no one’s walking away satisfied. Maybe it’s been a collective decision to wait on today’s announcement. The news will make headlines, but the market’s reaction will tell the real story.
We’re not here to make political predictions — those always feel pointless — but we can prepare for the reaction to this latest “known unknown.”
And what better way to plan than to revisit the key price levels — or, said differently, support and resistance. There are plenty to go around:
Moving averages, anchored VWAP lines, trendlines, breakdown zones, breakout zones, former highs, former lows, trading box boundaries, retracement levels.
All of them have come into play lately. Let’s start with the chart we’ve been referencing every day the last few weeks.
Moving Averages & Anchored VWAPs
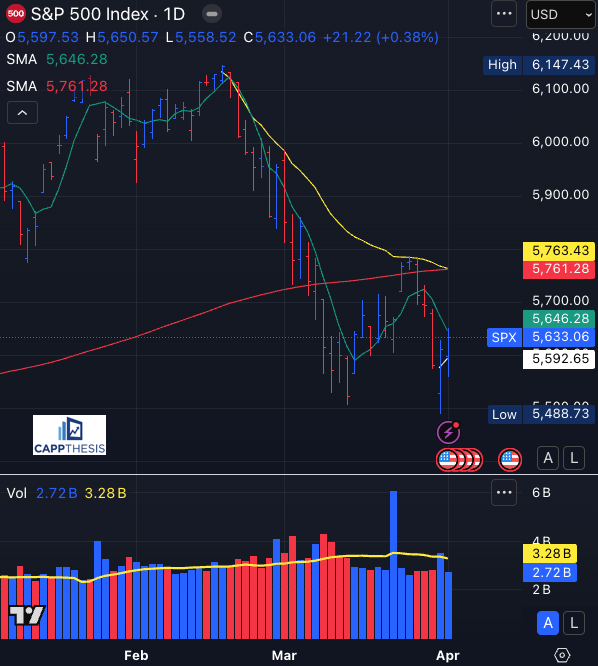
First, since the SPX undercut the 3/13 intraday low on Monday, we’ve re-anchored the latest VWAP line to 3/31 (in white). That’s currently sitting at 5,592. The SPX briefly slipped below it on Tuesday — before staging a rally.
That bounce, however, stalled right at the short-term 5-day moving average, which has now turned lower again.
Just overhead on this chart are two other key lines: The 200-day moving average, and the Anchored VWAP tied to the 2/19 high — both clustered around 5,760.
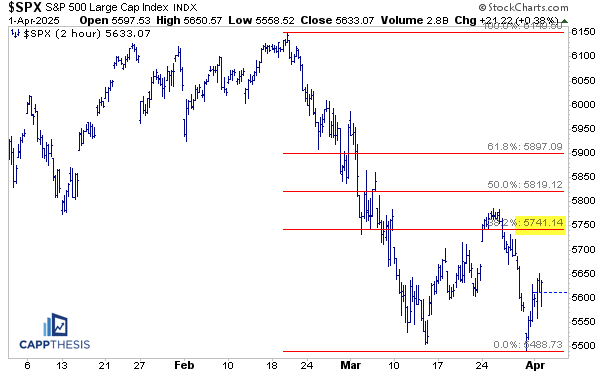
Retracements
The SPX failed to make much headway through the 38.2% retracement level of the sell-off from two weeks ago (initially measured off the March 13 low). Now, using this Monday’s low as the reference point, that 38.2% retracement level sits at 5,741.
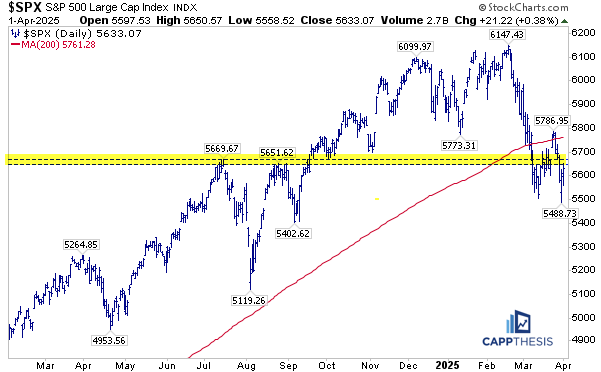
Former Highs & Former Lows
The 5,650–5,670 zone includes the former highs from July and August, as well as the late September lows. It also marks the breakdown zone of the bearish flag pattern (see the pattern section).
Just above that sits the November low near 5,700.
While these reference points are from further back on the chart, the fact that price action is now unfolding in the same area makes this entire zone meaningful — regardless of how old those levels are.
Patterns
We’ll learn a lot about how serious sellers are by how the recent bearish pattern is treated and how the second bearish formation that’s been building plays out…