


Daily Price Action
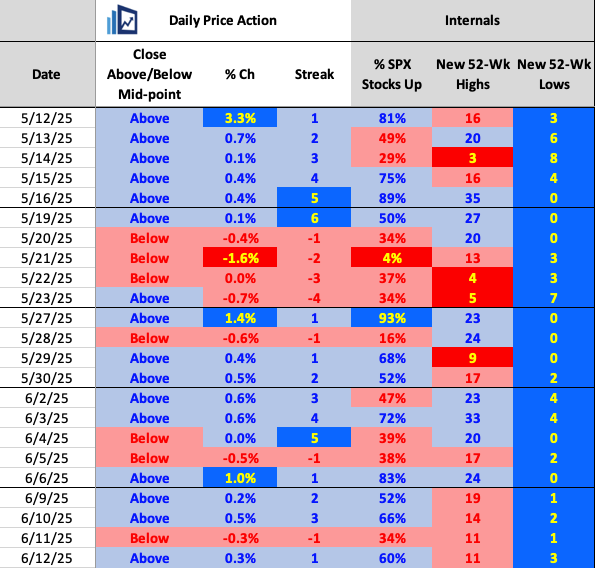
The SPX now has had positive breadth in four of the last five days; ditto for closing above its midpoint. This trend will be an important one to monitor if, indeed, today’s action materially changes things going forward.
Drawdown Scenarios
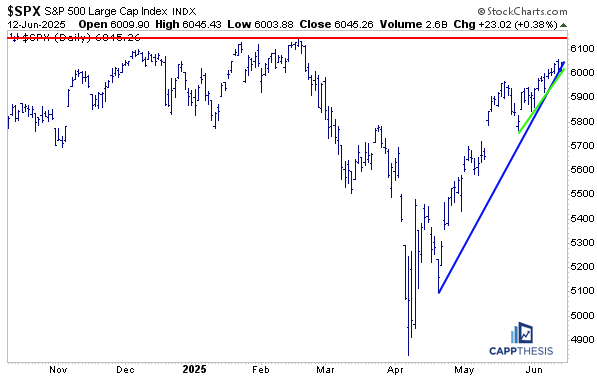
Despite the S&P 500 futures contract trading off its lows from last night, the odds are high that the steep uptrend line gets broken today. It has been bound to break given how consistent the upswing has been the last two months. Indeed, it’s always about how the market closes, so seeing how well it can battle this line will be important to watch.
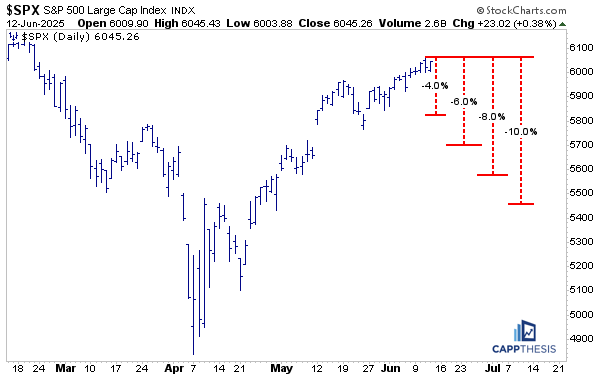
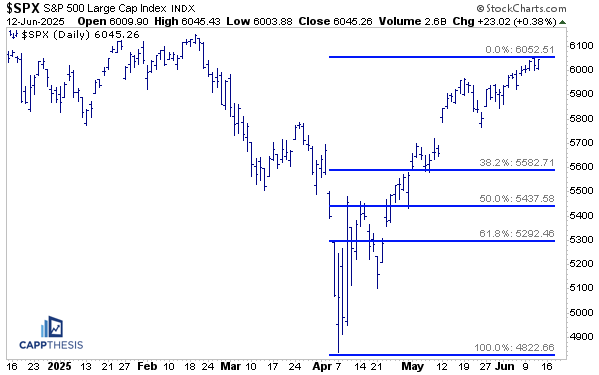
Next, let’s look at some potential drawdowns. Here’s how pullbacks between 4-10% would look on the daily chart. Up to this point, the biggest peak-to-trough move since 4/21 has been -3.3% from the May 19th intra-day high through the May 23rd intra-day low.
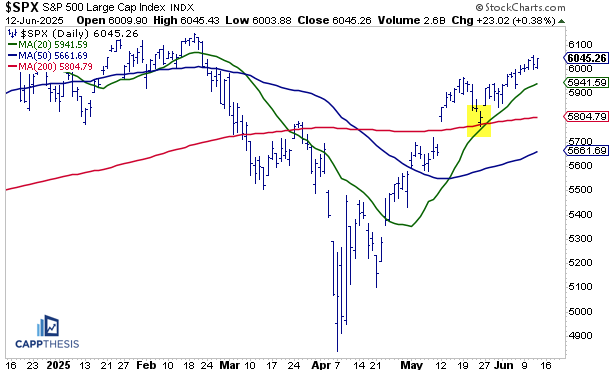
These numbers hold more weight when they line up with other key technical parameters. A 4% decline from this Wednesday’s high would put the index near 5,800…
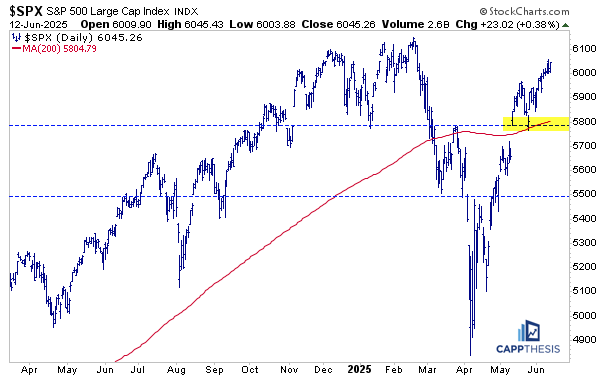
… and 5,800 has been a very important and clear support (and resistance) level since the SPX first hit it way back in October. The SPX has touched the 5,800 level in October, November, January, February, March, April, and May. Would it be any surprise to see it hit again in June?
5,800 has even more significance now given that the 200-DMA is trading right near it at 5,804.
Regarding the other key moving averages, the 20-DMA (currently near 5940) was last tested on the recent lows on 5/25. That also was the last time that the SPX was in contact with the 200-DMA. Clearly, both lines held. The index has been trading about the 20-day line since 4/17 – or nearly two months – which is a long stretch.
50-DMA is a bit lower, near 5,660.
The 38.2% Fibonacci retracement level is near 5,582. That’s 8% below Wednesday’s high.
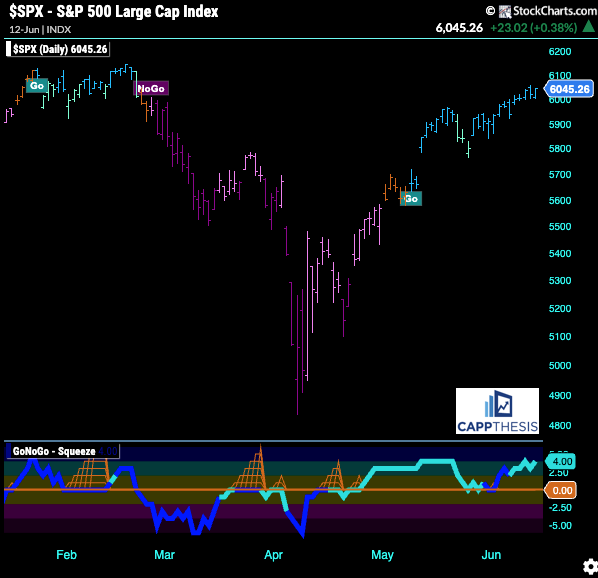
GoNoGo Trend
The SPX remains in a strong bullish trend heading into today’s session. We’ll be watching this closely for any change.
Patterns
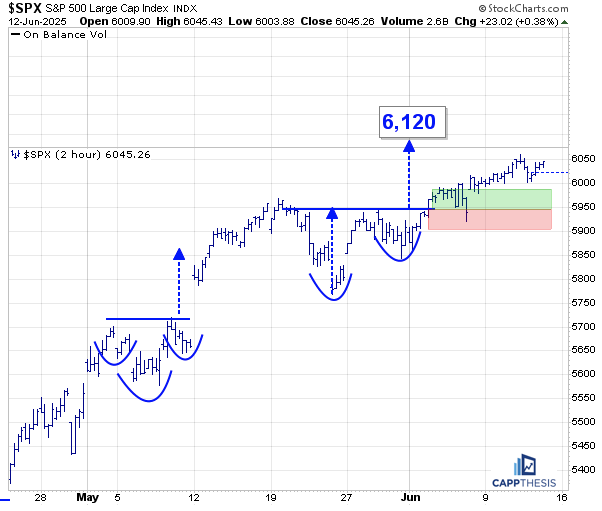
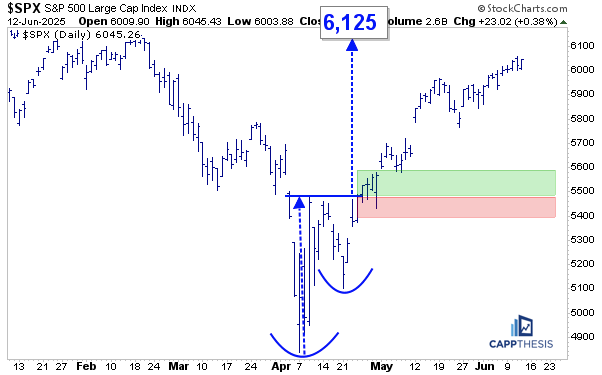
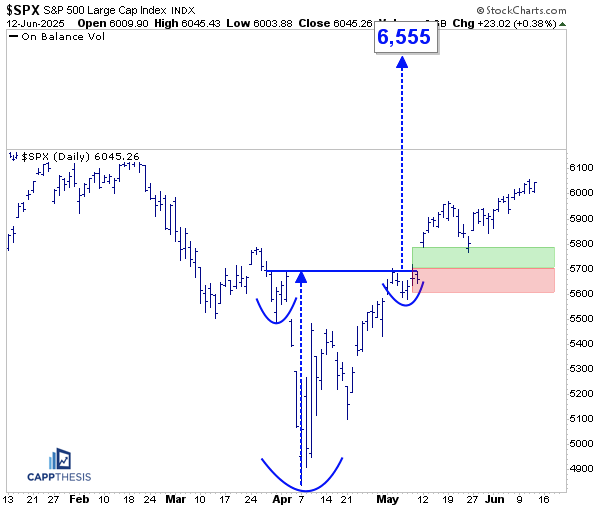
The same three live bullish patterns remain alive, targets 6,120, 6,125 and 6,555, respectively. Seeing how well the SPX can hold above the 5,950-breakout zone will be telling, as well.
Potential Bearish Pattern
We’re still keeping an eye on this potential bearish pattern, which would become clearer on any sell-off greater than we’ve seen lately. This remains the case…
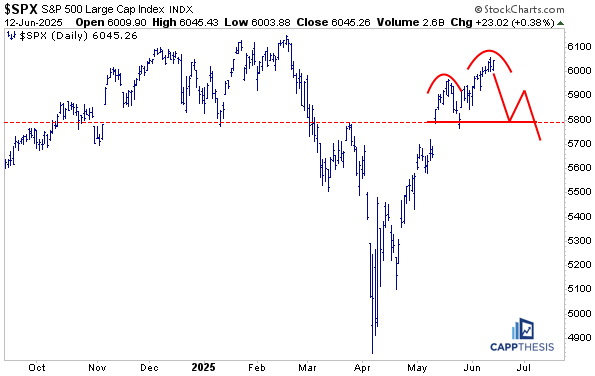
Chart Trades
I wrote the following blurbs early last evening before the news came out. So, the odds of these breakouts working in the short-term have decreased. But the setups are clear, thus, I want to share them anyway. If things go better than expected today and next week, these two could benefit. Let’s keep them on our radar screens…