


META
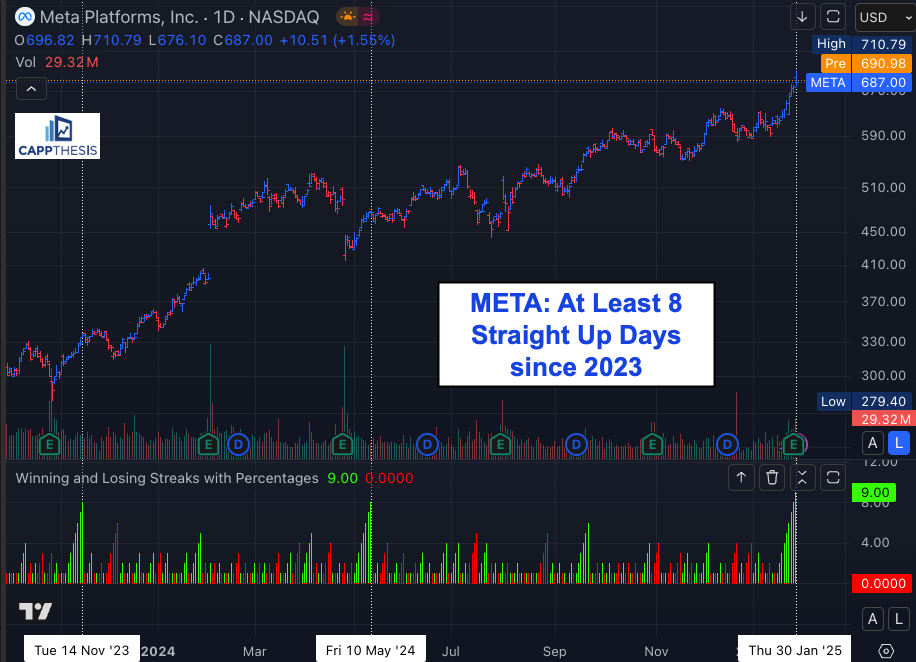
META was rallying before its earnings announcement this Wednesday and continued to rally yesterday in response to it. In total, the stock now is riding a nine-day winning streak, which is the second longest in its history: In late September 2015, it was up 11 straight. We’ll recall that happened during a snapback between two very volatile trading periods – for both the stock and the market in aggregate.
Most recently, META logged two other eight-day winning streaks since the October’23 low – the periods ending 11/14/23 and 5/10/24. And while buying immediately after those streaks ended didn’t provide a favorable risk-reward scenario, waiting to buy the ensuing dip in the weeks that followed ended up being a good strategy.
Needless to say, right now META is short-term extended, and being patient for a lower entry point would be the prudent approach again now.
MSFT
MSFT stood out yesterday for the wrong reasons: the 6.1% decline post earnings was the stock’s worst showing since 10/25/22. The question, of course, is whether this presents a buying opportunity now. Here’s what we know:
MSFT bottomed soon after reporting earnings the last three times going back to April’24. While those rallies didn’t help the stock break through its now, year-long trading range, those were the times to take advantage of short-term weakness.
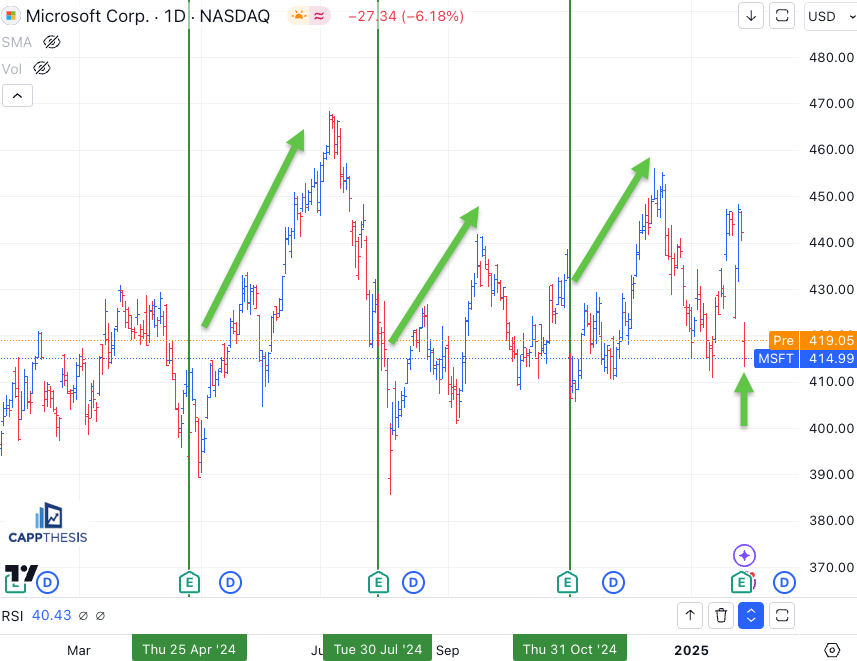
It wasn’t immediate this past summer with the general market getting hit hard to start August, but the stock quickly recovered. That was the only time it noticeably dipped below 400 over the last year, too.
With MSFT up pre-market, the beginning stages of another mean-reverting trade could be underway. For any long trades from here, an obvious stop loss would be near 410, where it bounced from twice over the last few weeks. The initial target would be its most recent trading high near 448.
AAPL
Like MSFT, AAPL has done well post reporting earnings over the last year, but this time, it got a head start, ripping strongly even before the stock’s strong reaction to last night’s report. A clear reason for the bounce back was its prior underperformance.
We profiled AAPL two Fridays ago on 1/17 with this chart that showed how the stock had dropped 12% in 13 trading days. Prior 13-day, 12% declines led to bounces each time since late 2020 -some better than others. It bottomed again a few days later.
So now what?
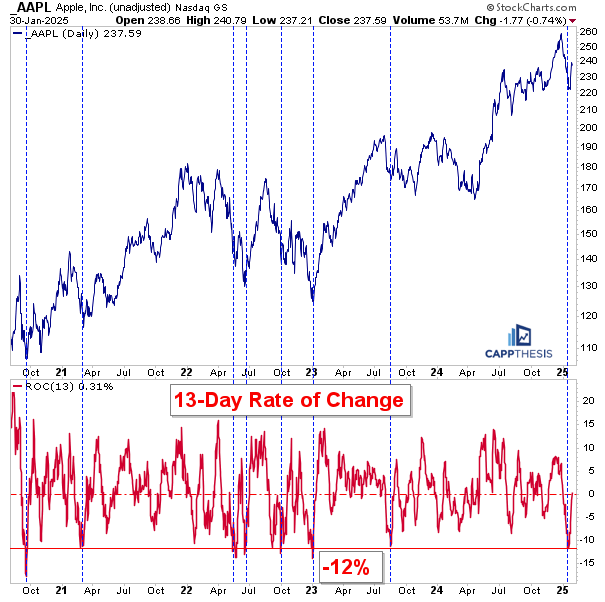
From the January 21st low to yesterday’s high, AAPL gained about 10%. Factoring in the current premarket gain, the stock looks to be up another 2% by the open – thus, a +12% move in a very short amount of time.
But as we can see, the short-term pop only pushed its 14-day RSI back up to the 50 zone through yesterday. And even after today, the indicator won’t be overbought. The stock also is just getting back to its 50-day moving average.
This looks similar to what happened last May. (The green arrows show where the stock closed the day it reported earnings. The blue arrow = where it opened the next day.) …
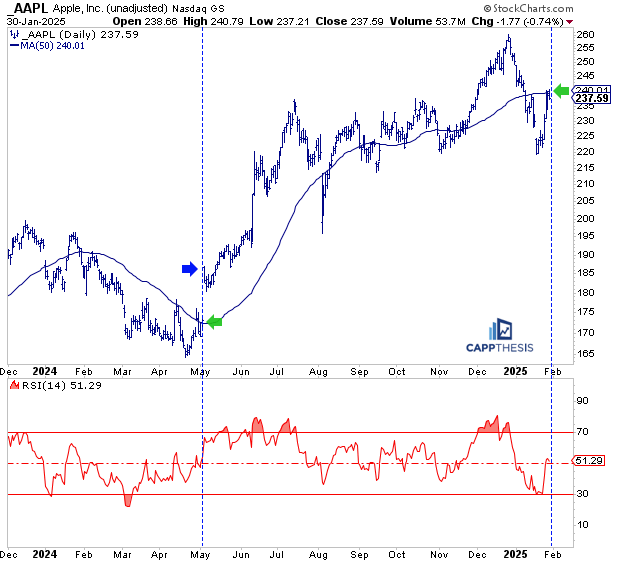
AAPL was reeling for a longer amount of time back then, but it had just rallied 7% off its low, which brought the RSI back to the mid-point right before it reported earnings. The extremely strong reaction then shot the stock above its 50-DMA the following morning – like now. From the open price that day to its trading peak in July, AAPL gained 27%.
This isn’t a prediction that the same thing will happen again now, but we know how robust momentum can be in AAPL when it gets going. Thus, seeing it extend beyond today’s opening gap wouldn’t be surprising.