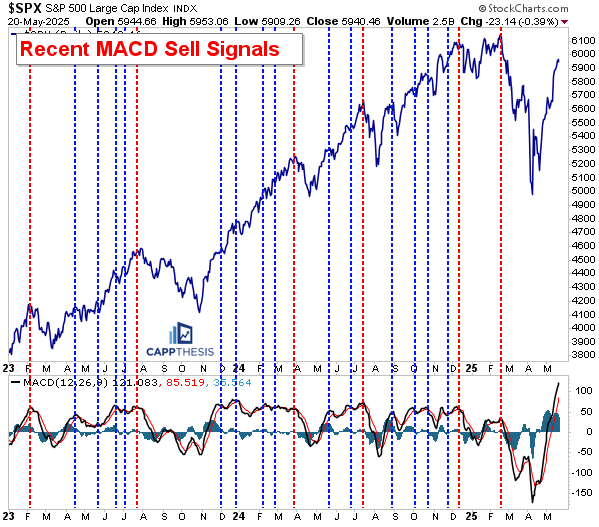
Below an excerpt from today’s Opening Look.
Also, please check out this video I recorded for StockCharts TV yesterday.
MACD Hits Highest Level Ever…
As discussed recently, the latest MACD buy signal worked very well in April – after two prior failed signals earlier this year.
🟢 The SPX’s recent rally now has since launched the MACD line its HIGHEST LEVEL EVER (121).
🔴 This has happened just weeks after it registered its SECOND LOWEST LEVEL EVER (-175). During the depths of the COVID crash in March’2020, it hit -237!
Pretty wild, right? Here’s why.
The MACD (Moving Average Convergence Divergence) is a momentum gauge based on the difference between the 12-day and 26-day EMAs. When markets reverse hard — like they just did off the April lows — that difference can spike, which, of course, it did.
What makes this swing even more remarkable is how fast it happened. The MACD collapsed to a near-historic low during the April crash and it has now ripped higher in record time.
Here’s the nuance: the extreme MACD readings aren’t exactly apples-to-apples with past trading environments.
👉 The reason is simple:
The SPX is trading near 5,900. Back in 2020, for example, before and after the COVID crash, it was hovering around 3,000. And because MACD is based on raw point differences between EMAs — NOT percentage changes — it naturally inflates as the index level increases. In other words, if the SPX was trading at 5,900 in 2020, the MACD would have hit EVEN higher and lower levels than it did.
The takeaway is this:
The magnitude of the MACD move is part real momentum, part price-level-related. Indeed, the market just staged one of its sharpest reversals in years, and that deserves attention. But the fact that the MACD is hitting “all-time highs” has as much to do with the S&P’s absolute price level as it does with the strength of the rally itself.
There’s no denying the massive swing, as momentum flipped decisively. Whether it’s sustainable or not is another question…
The Next Sell Signal
Sticking with the MACD indicator, we’re bound to get another sell signal at some point, possibly very soon. And while buy signals hadn’t worked until recently, the last two sell signals worked very well.
🎢 The last time we had more than two consecutive successful MACD sell signals was April’22 – Feb’23 when four in a row nailed key trading tops. Once again, we’ll know what kind of market we’re in over the days/weeks following the next sell signal.


Well said Frank. MACD should be calculated as a % of the underlying market