


Topics Covered today:
Daily Stats
-Key Points
-Data table
-Sectors
-Index breadth
-Best/Worst 20
Market
-Short-term
-Higher lows
-Long-term
-% SPX stocks > moving avgs
-GoNoGo Trend
-Two live bullish patterns
-Potential bullish pattern
Key Charts
-XLY Consumer Discretionary
-IBIT Bitcoin
Chart Trades
-COR
-MCK
-WMT
Have a great Tuesday.
Key Points
The SPX broke its two-day winning streak with its biggest decline since 6/17 yesterday, with the sell-off being attributed to tariffs. With the index now up 30% in three months, ANY news could have resulted in a loss. And considering that the news, itself, wasn’t exactly good, the market had every reason to sell off a lot more.
While the term “uncertainty” gets thrown around a lot (way too much) when describing the market’s gyrations, the level of uncertainness is at an entirely different place now vs March and April. Seeing how well the market digested yesterday’s tariff update versus back then was all the evidence we needed to confirm this.
Yesterday’s decline simply put the SPX back near levels from last week – so far.
Last Five Trading Days
Daily Price Action
The SPX finished just slightly below its mid-point yesterday and had the worst breadth session since 6/17. That said, it was only the second negative day of internals in the last ten; the last time we had two straight negative breadth days was 6/17-18.

Sectors
The safe havens outperformed all session on Monday, but only Consumer Discretionary fell more than 1% – and that was because of one big stock having a very bad day. Notice how the equal weight Consumer Discretionary ETF actually was the third BEST sector.

Breadth
At the index level, the NDX’s internals outperformed, but not by much.

Best & Worst 20 ETFs
Performance was scattered yesterday, but the declines were a lot bigger than the gains in aggregate.

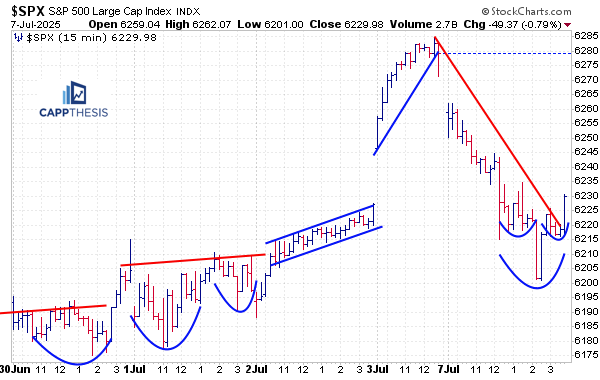
Short-term
The drawdown from last Thursday’s high to Monday’s low totals 1.4%, which clearly is very shallow. But it’s not that smaller than the prior pullbacks since late April. We discussed how a consistent, non-volatile advance like this lasted for five months from Nov’23 – March’24.
So, is a greater pullback due? Yes. Is a greater pullback a guarantee right now? Nothing is a guarantee… It’s about the follow through or lack thereof.

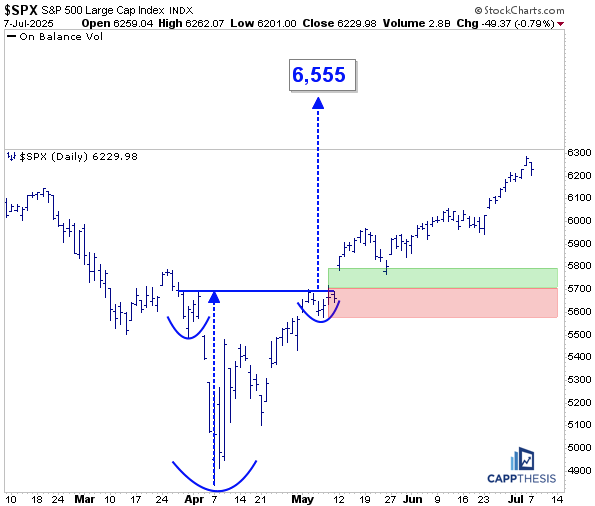
Higher Lows
We last showed this chart in May as the SPX dropped 3.3%. With that decline starting just under the 6,000-mark, many market observers were calling for a much bigger rollover.
At the time, we compared the current snapback to the most recent versions over the last few years to show the first pullback after an explosive pivot low set the stage for the second up leg. We further noted that said second leg was bigger than the first the last two times. We’re not there yet, but this second leg already has extended further than many thought was probable or possible.

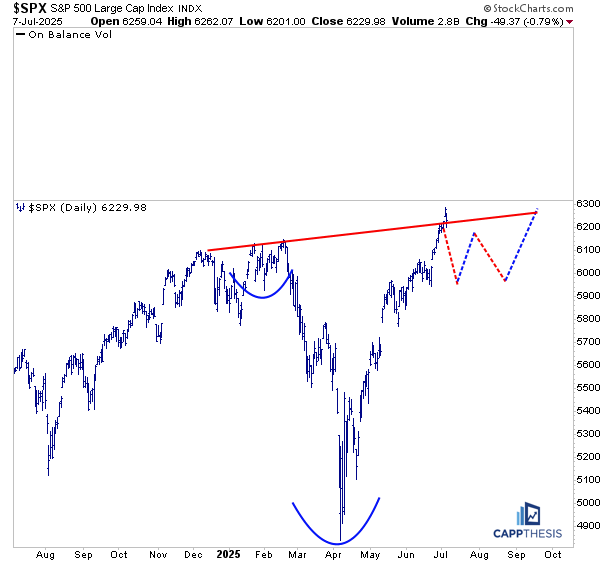
Long-term
Zooming way out, here’s how the comeback looks on this 12-year chart. We’ve shown this one before, too; this view helps eliminate the short-term gyrations, displaying only biggest and/or most volatile moves.
Needless to say, the blue arrows (uptrends) have extended much longer than the red arrows. And if that trend continues, then this most recent push to new highs could extend much further. How can this happen? Bullish patterns much continue to form and see their upside targets hit.

% SPX Stocks > Moving Averages
The amount of stocks trading above their respective moving averages continues to be strong. The biggest change the last few weeks is that nearly 65% of the SPX now are above their 200-DMAs. Bearish traders will point out that the market topped the last time this number was near 65% in February’25. That’s true, but…

… the last time that the number FIRST hit 65% after coming back from a big downturn was in late 2023 – highlighted in yellow. And that led to a lot more upside in the weeks and months that followed. Whether that happens again or not, this is a good comparison to keep in the back of our minds.

GoNoGo Trend – Daily
The SPX remains in a bullish trend heading into today’s session.

Live Patterns
Our two live patterns remain – targets of 6,555 and 6,745, which could be with us for a while going forward. For those to eventually get achieved, though, new, smaller versions will need to be constructed.


Potential Patterns
The large potential bullish pattern remains a possibility.
XLY Consumer Discretionary
As noted above, XLY was the worst performing sector ETF yesterday, but despite its recent volatility, the ETF remains technically constructive: XLY is above its big breakout zone (205), continues to trade above its upward sloping 200-DMA and its 14-Day RSI has been trading in the upper half since mid-April. The next step now is to fully leverage the trading box it’s trying to break out from.

IBIT Bitcoin
With Bitcoin continuing to percolate near its highs, IBIT has remained close to its recent high point, too. The big potential bullish formation is clear, and an eventual breakout would target the 83-zone.

COR Cencora
Even though Healthcare overall has continued to lag, some stocks have performed well and are sporting attractive technical patterns. We’re profiling two of them here as Chart Trades.
COR has been trending higher all year so far, respecting its rising 50-DMA every time it has revisited it since February. The stock just bounced near the line again and now has the chance to capitalize on the pictured cup and handle pattern. A breakout would target 319, which would be considerably above its early May spike highs.

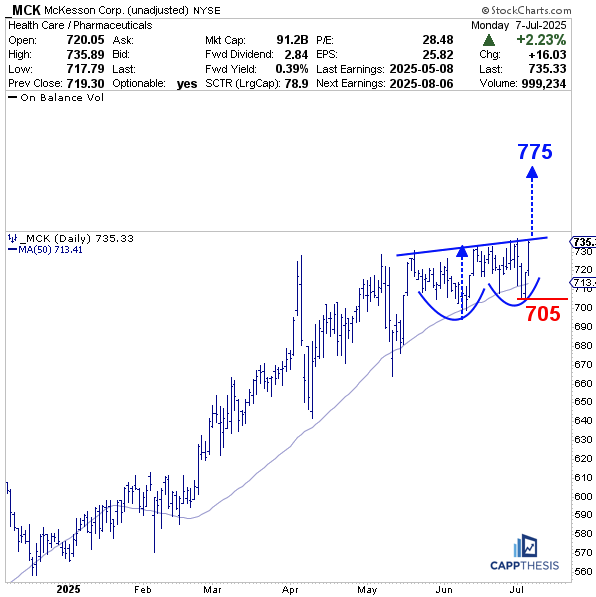
MCK McKesson
MCK really stands out among some of the lagging drug stocks; in fact, it shares a similar looking pattern to COR, just discussed above. It, too, h has been riding its upward sloping 50-DMA and has constructed a potential cup and handle pattern over the last two months. A breakout would yield an objective up near 775.
WMT Walmart
Lastly, WMT has been quietly moving sideways since late April, which isn’t surprising since many consumer staples names have stalled after the initial snapback. But by doing so, the stock now has built TWO potential bullish formations. Both are crystal clear here on the chart.
The smaller cup and handle formation in green has a target near 106; the much larger inverse head & shoulders pattern in blue would have a target all the way up near 120. Both would be triggered with a decisive through the 100-level.
