


Good morning - Below is today’s pre-market Opening Look report, along with a recent Chart Trade idea.
Also, check out the interview I did with NYSE Live this past Friday. We discussed CPI, the Fed, tariffs, S&P 500, earnings, sectors & more.
Key Points
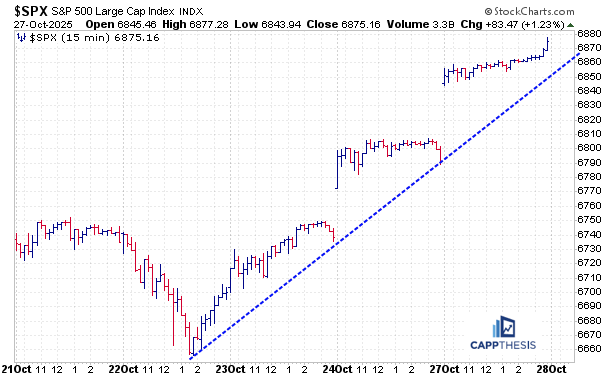
The S&P 500 gained 1.2% to start the week yesterday, which was its second-biggest jump since August 22. This pushed the index to fresh all-time highs, as it moves closer to the 6,900 level for the first time.
Among other things, this has pushed the index’s short-term RSI back into overbought territory, which we’ll touch on today, along with breaking down key ETFs and a new trade idea.
Last Five Trading Days
Daily Price Action
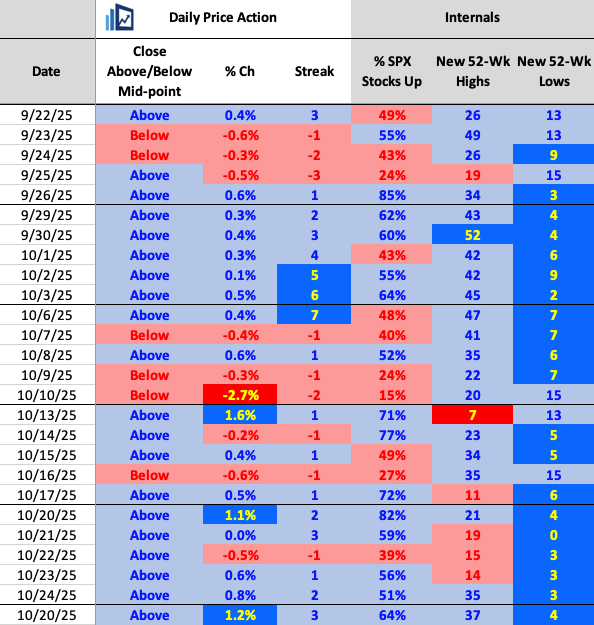
By gapping higher and closing near its highs, the index also logged its 10th close above its intra-day midpoint in the last 11 trading sessions. Market breadth has been positive in six of the last seven days, as well. New 52-week highs ticked up to 37, which is still relatively low, though.
Sectors
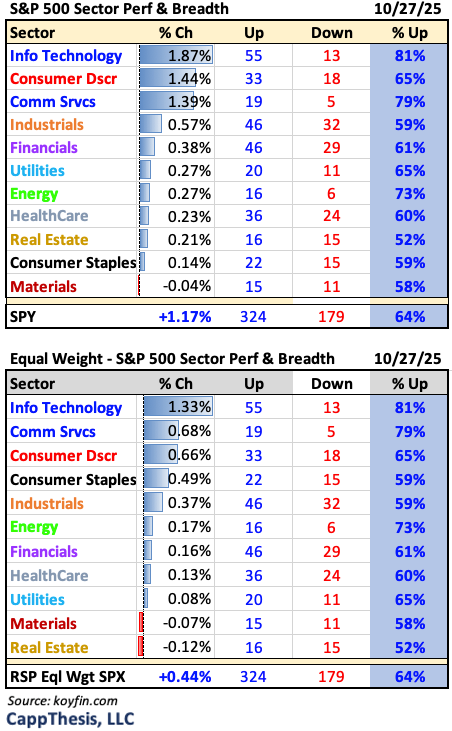
Technology was the leading sector for the second consecutive day — the first back-to-back days of leadership since its three-day run from September 18–22. Tech was joined by its large-cap growth peers, with Consumer Discretionary and Communication Services both also up more than 1%. Overall, as noted here, every sector posted positive breadth.
Index Breadth
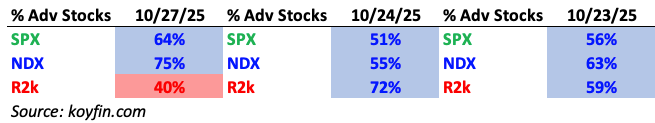
The NDX noticeably outperformed and the R2k materially lagged from an internals-perspective yesterday.
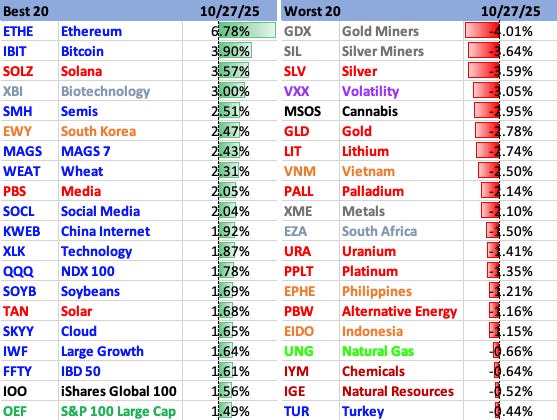
Best & Worst 20 ETFs
Aside from growth, ETFs tied to crypto staged a strong comeback, with South Korea also extended its huge move higher. On the downside, precious metals and miners continued to struggle, as each searches for a catalyst to eventually reverse the recent weakness.
A String of Good Mondays
The SPX now has logged three 1% gains in October, with each one — ironically — happening on a Monday. While that pattern probably doesn’t carry any real predictive value, it does highlight just how consistent the buy interest has been over the past several weeks to months.
As part of this, here’s an updated look at the 1% move table for 2025. Over the six months since the April volatility, the S&P 500 has logged four different months of three 1% gains and 1% loss. The other two months — July and September — had zero 1% moves altogether.
Let’s also remember the seasonal narrative: both September and October are historically considered the most volatile months of the year. If significant volatility were going to return, these months would’ve been prime candidates. But with just a few days left — and several key earnings reports still ahead — that shift has yet to materialize. Again, from this table, the two-way volatility looks NO DIFFERENT than the prior few months.
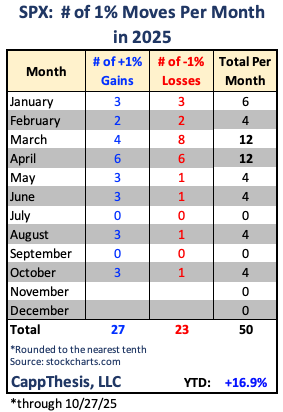
Since May 1, the tally of 1% daily moves now stands at 12 gains vs. 4 losses — spread across 123 trading days, or essentially six months of market action.
This type of environment has literally built the uptrend that has been in place since then. A period marked by low volatility has allowed bullish patterns to form, price targets to be met, and key trend signals to stay intact.

Short-term
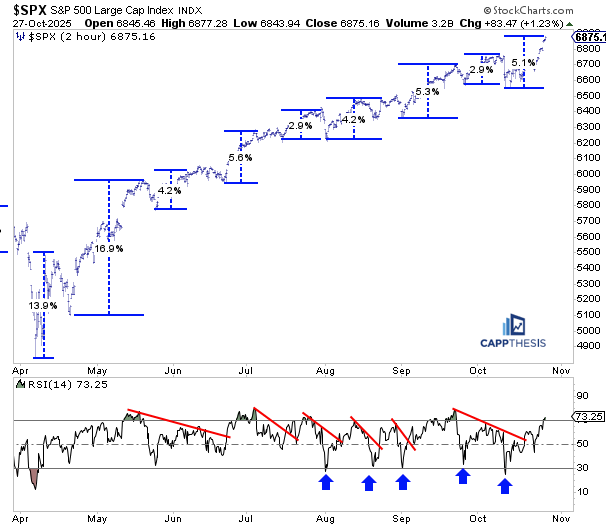
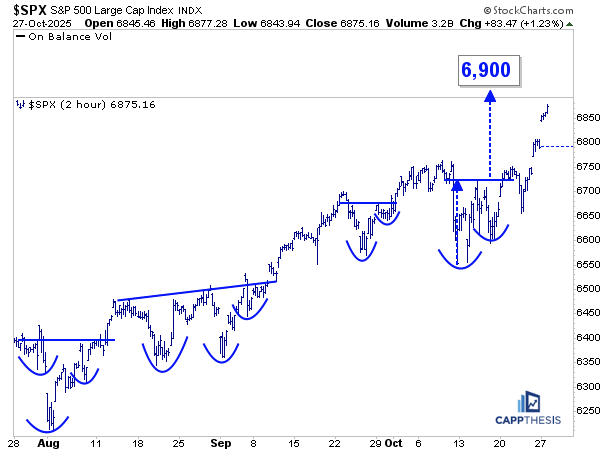
Looking at the 2-hour chart, the trough-to-peak move from the October 10 low to yesterday’s high now totals 5.1%. That places this rally among the strongest short-term advances we’ve seen since late May.
Just as important, yesterday’s surge pushed the 14-period RSI on the 2-hour chart back into overbought territory.
Recall, this was a missing ingredient during the prior September–early October advance — that move failed to break above the 70 RSI threshold, and the marginal breakout attempt ultimately reversed into that 2.7% decline on 10/10/15. That had us watching closely to determine whether momentum was fading.
Now, with two-hour RSI confirming overbought conditions, it signals that positive momentum remains in place.
After a gain of more than 5% from the recent low, it wouldn’t be surprising to see a short pause develop — especially with plenty of catalysts ahead in the coming days.
Patterns
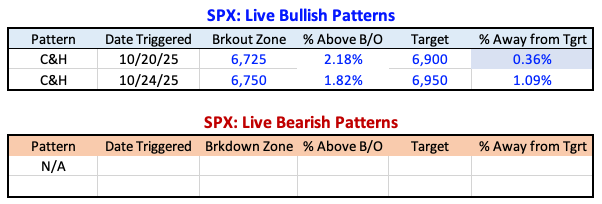
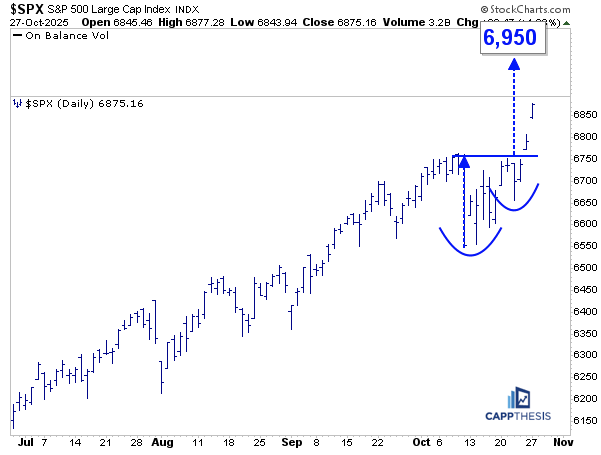
Needless to say, with yesterday’s big move, the S&P 500 is now much closer to achieving its first short-term target at 6,900, and it closed within just 1.1% of 6,950 larger bullish pattern objective, as well.
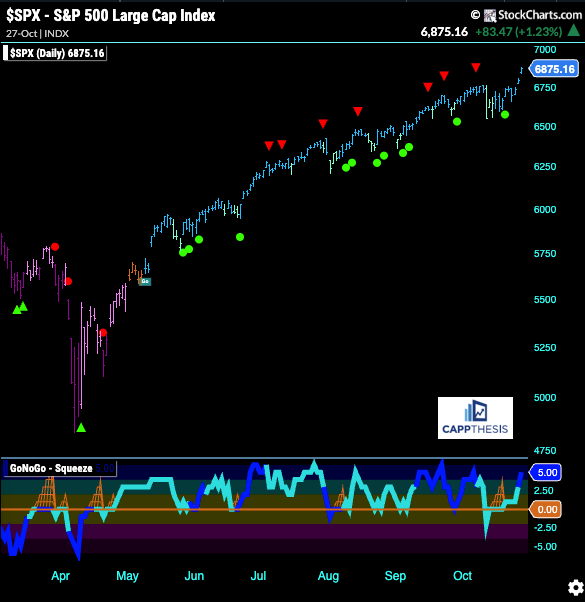
GoNoGo Trend – Daily
The GoNoGo trend remains bullish. With the indicator now back to overbought territory, the most likely will trigger another counter-trend signal (red arrow).
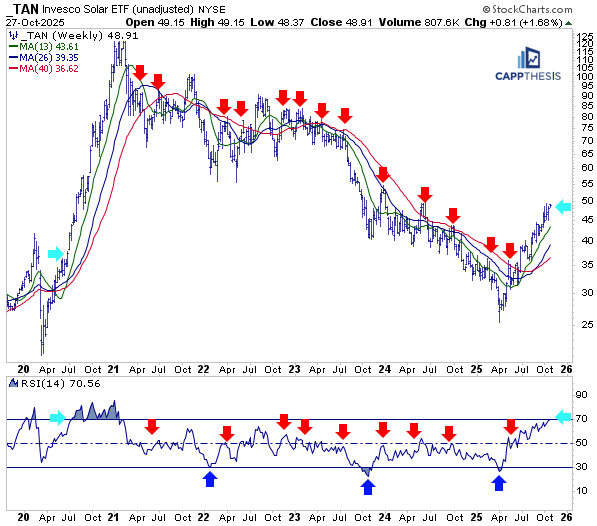
TAN Solar
TAN was among the leaders yesterday, adding +1.7%. And while the week isn’t over, this strength currently has pulled the weekly RSI back to 70. If it closes above that level by week’s end, it would mark the first official weekly overbought reading since early 2021. As we know, that was when TAN — along with many speculative ETFs and stocks — topped out.
But more importantly, the first time TAN entered a weekly overbought condition during that 2020–2021 cycle was early July 2020 — highlighted by the light blue arrows — and there was still significant upside left from both a duration and percentage gain standpoint.
This represents an incredible turnaround for an area that has been stuck in a multi-year downtrend. We’ve talked repeatedly about how each prior rally attempt failed at key weekly moving averages, with the RSI unable to climb much above the 50s. That has now changed.
With the weekly RSI finally confirming overbought, TAN has reached its next major milestone. And based on prior behavior, we know exactly how it can continue to advance: through short-term consolidations that digest gains constructively — a pattern that played out consistently throughout the post-COVID rally as well.
XLY Consumer Discretionary
With XLY’s other major holding reporting Thursday after the close, we’ll get a clearer sense of how much further the ETF can extend its recent up-move. As we’ve shown before, the weekly log chart continues to reflect an ongoing breakout, with the 248-target now not far away. That would amount to roughly a 20% advance from the spring breakout zone…
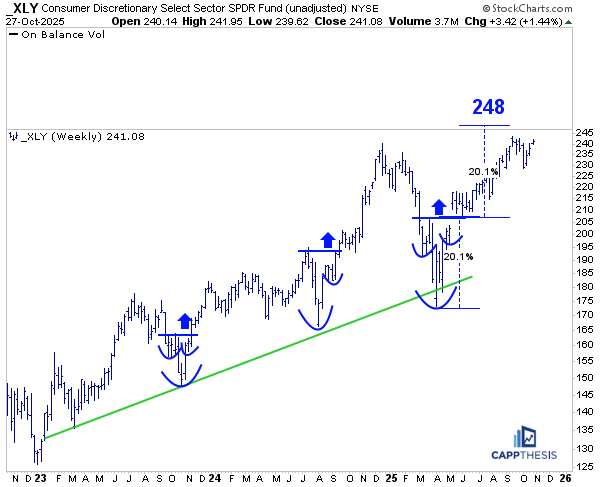
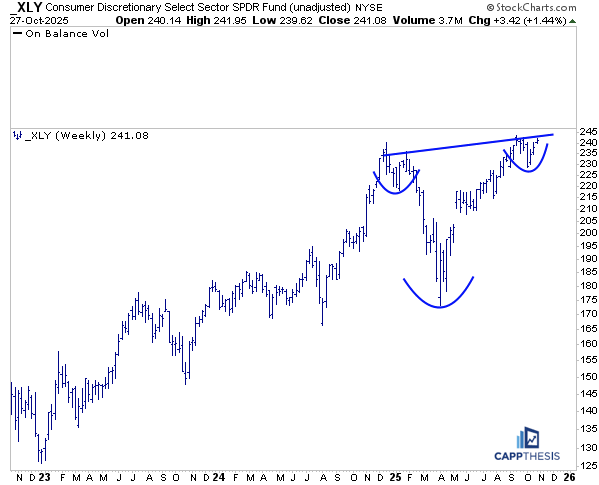
If and when that objective is achieved, XLY would also be breaking out from an even larger inverse head-and-shoulders pattern, which features an upward-sloping neckline.
This is about as bullish a technical structure as we can get, given that it would coincide with new all-time highs, leaving no overhead resistance. That would unlock a substantially higher price target — but we’ll address that level if and when the breakout occurs.
XLI Industrials
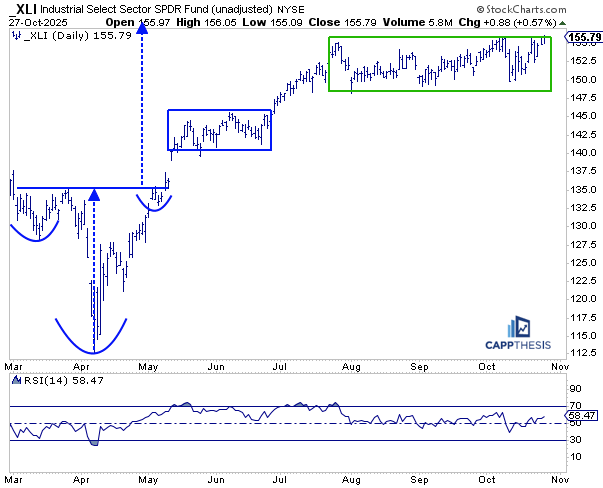
XLI didn’t stand out in yesterday’s action, but we’ll continue profiling this long trading range. If XLI can eventually break out, it could be a major driver of the market’s potential to extend gains through November and December.
Remember, Industrials hold the largest number of components within the S&P 500 — 79 stocks. For perspective, Financials are second with 75, and Technology ranks third with 68.
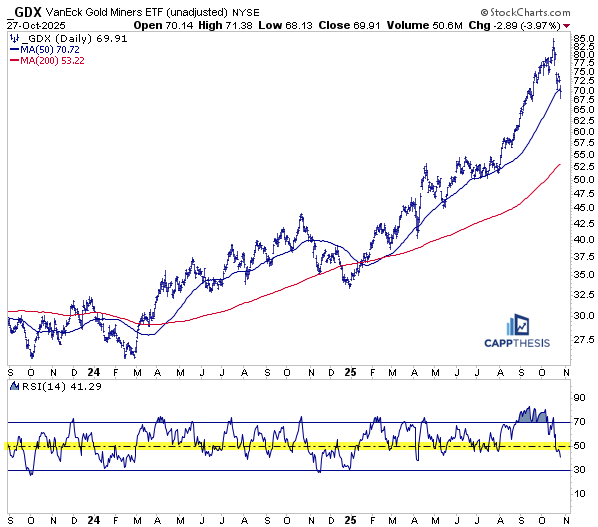
GDX Gold Miners
Here’s an updated look at two GDX Gold Miners charts. With continued weakness this morning, price is now approaching the first 38.2% retracement level near 65. Since that level sits just below the September low, it could become an area of interest for prospective buyers. For now, the ETF remains in support-discovery mode.
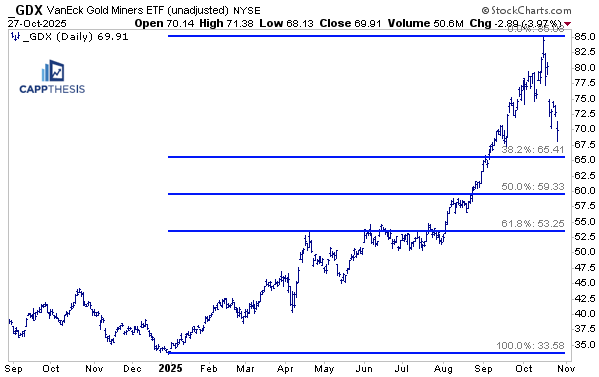
GDX is now back below its 50-day moving average, and its RSI — which pierced the 50 level a few days ago — closed at 41 yesterday. This marks a clear shift from the strong technical picture just over a week ago.
And while the decline has been sharp, it’s important to recognize that GDX has undercut the 50-day dozens of times over the past two years during its jagged, but persistent uptrend — one that remained intact through July of this year when the trend turned parabolic.
Throughout that stretch, the RSI has regularly cycled from overbought back to the 40s, as well, even dipping toward oversold on several occasions — most recently at the very start of this year. Given how extreme the mid-July rally became (RSI near 90), this current pullback reflects the rubber band snapping back.
Again with GDX now approaching the 38.2% retracement zone, a support zone eventually may re-emerge soon. Once that happens, we’ll be focused on how the next pattern takes shape.
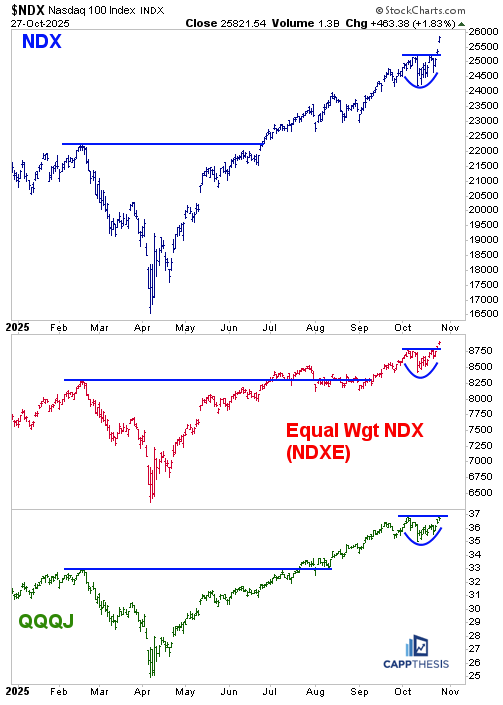
NDX, NDXE, QQQJ
Given that large-cap growth continues to lead, we wanted to take a look at the NDX versus the equal-weight NDX (NDXE) and QQQJ — the Nasdaq Next Gen 100, which tracks the next 100 largest stocks after the Nasdaq 100.
Not surprisingly, the NDX has been leading, and is now well above its prior highs. But the other two — which are not heavily skewed toward mega-caps — look constructively similar.
It took longer for both NDXE and QQQJ to break out above their former early-2024 highs, but after doing so, each has extended its advance. The NDXE also broke out to new all-time highs yesterday, while QQQJ is close to doing the same.
Directionally, then, this is exactly what we want to see — all three moving higher together, using intermittent digestion phases to reset before breaking out again.
We will continue to track all three, watching for any potential divergences. One thing to keep in mind: whether QQQJ fails to confirm a breakout as smaller growth names report earnings over the next few weeks.
From 10/23/25:
CRWD CrowdStrike
Turning to our two chart trade ideas for today, here is a potential inverse head-and-shoulders pattern in CRWD (CrowdStrike). As we know, it’s a volatile stock, but since it doesn’t report earnings for a few more weeks (December 2nd), we have some time for this formation to take shape.
The pattern is not yet complete, with the stock still having some distance to go before breaking out to new all-time highs. In fact, if CRWD fails at current levels, the price action that currently represents the right shoulder could morph into a smaller, bearish consolidation pattern of its own. That’s why we use tight stop losses — a pullback below roughly 471 would negate the big bullish pattern.
If all goes well and we see strong follow-through soon, the measured move target would project toward the 629 area.
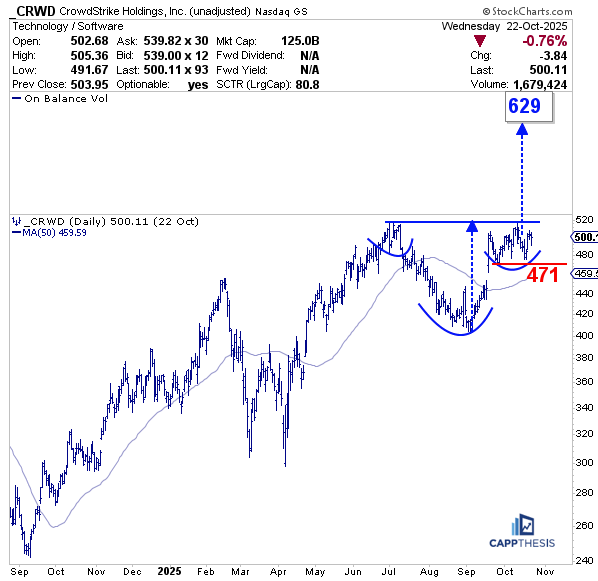
With CRWD in the $540s, it sure seems like the pattern's complete...
That inverse head and shoulders setup on CRWD looks really clean. I like that you mentioned the tight stop around 471 because that right shoulder could easly morph into something bearish if momentum fails here. The timing is interesting too since we have a few weeks before the December 2 earnings, which gives the patern room to develop without the binary event risk hanging over it. One thing that stands out to me is how CRWD has been consolidating since that July incident, almost like the market needed time to decide if the damage was permanent or just a speed bump. If this thing breaks out to new highs, the measured move to 629 would be around a 25 percent gain from current levels, which seems reasonable given the volatilty this stock typically has. The key will be wether enterprise spending holds up and CRWD can prove they have actually fixed the systemic issues that caused the outage in the first place.