


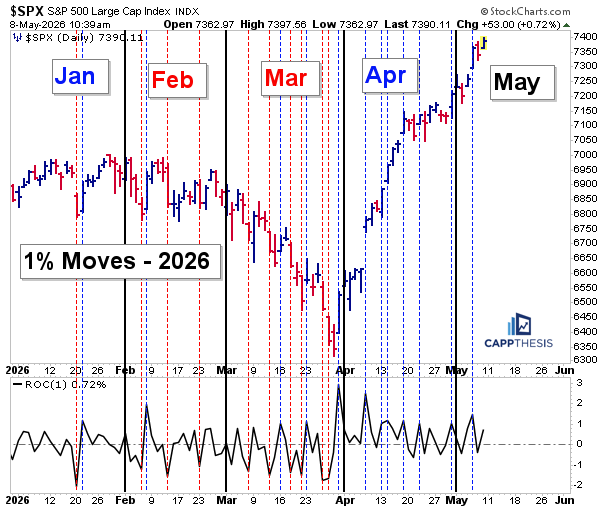
The S&P 500 has now logged eight 1% advances since March 31st, which, as we know, was the day this now five-week advance began. Over that timeframe, there have been 20 gains versus just seven losses.
More importantly, each of those declines has been minimal, with the biggest pullback totaling just 63 basis points, which occurred on April 21st.
It has been as one-sided an advance as we’ve seen in recent history — even more so than the major comeback we saw last year and any of the other substantial snapbacks that have taken place over the last decade…
From a statistical perspective, the move is now entering extremely rare territory.
Again, S&P 500 has now produced eight separate 1% gains without suffering a single 1% decline during the same stretch.
Prior to this occurrence, the last time we saw such a sequence was during the fall of 2015. Going all the way back to 1970, this type of streak has occurred only nine other times.
The longest run took place from January through May of 1985, when the SPX recorded 11 separate 1% advances before finally experiencing a 1% decline.
Other examples were scattered across very different market environments, including the powerful rebounds of the early 1980s, post-crash recoveries, and select momentum phases during secular bull markets.
What makes the current setup especially interesting is what happened after those prior streaks eventually ended.
At some point, of course, the market finally logged a 1% decline. That alone, however, did not automatically signal the start of a major correction or trend reversal. In fact, the four-week forward returns following those prior occurrences were relatively mixed overall.
More often than not, the market simply consolidated after such powerful upside momentum. The average four-week return across the previous examples totaled just +0.1%, essentially flat.
That suggests these periods of extreme upside persistence often lead to digestion phases rather than immediate continuation or outright collapse.
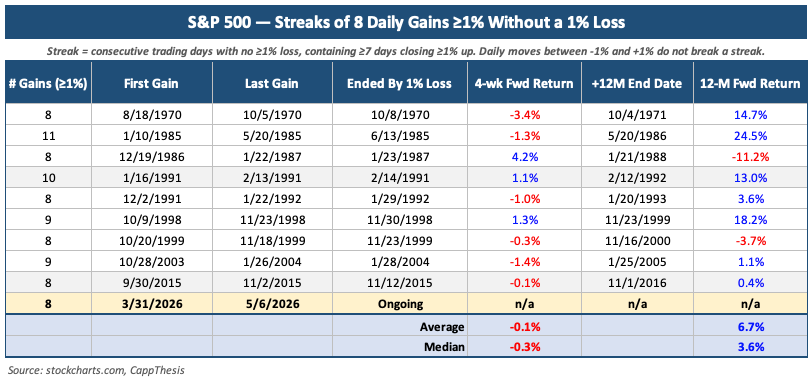
The longer-term results were mixed as well, though they leaned modestly bullish overall — not particularly surprising given the historical upward bias of equities over time.
The strongest 12-month outcome occurred after the 1985 streak, when the SPX gained another 24% over the following year. The weakest came after the late-1986/1987 period, when the market was down roughly 11% twelve months later.
The BIGGEST takeaway is that the streak itself did not reliably predict an imminent market collapse.
That is the key point for investors today.
Yes, the market is stretched on a short-term basis. Yes, momentum has been unusually one-sided. And yes, at some point we likely will see a larger pullback or at least a meaningful volatility spike emerge.
But history shows that finally seeing a 1% decline after one of these rare streaks does not necessarily imply the advance is immediately over.
More often, these periods simply transition from extreme momentum into consolidation as the market works off overbought conditions before determining its next directional move.
That’s something to be mindful of…
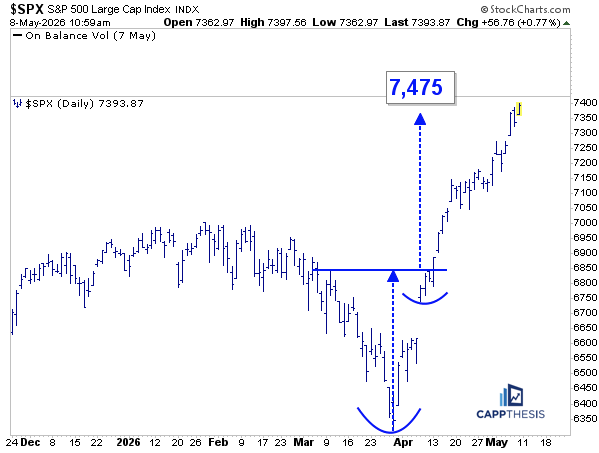
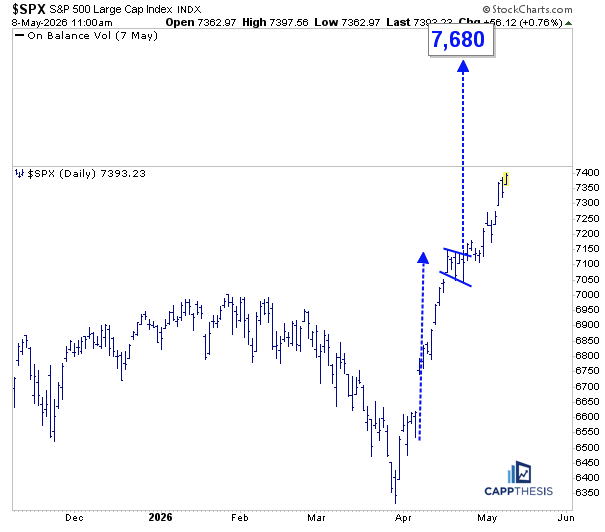
Most important for now is that the two bullish pattern breakouts remain in play:
CappNotes offers a small window into the work we do at CappThesis - a technical analysis newsletter company focused on classical chart patterns, trend, and risk management. Explore the full range of CappThesis services here: