


Good morning - I’ve received a number of questions about what’s included in our Opening Look piece:
Opening Look is our comprehensive daily, pre-market report, which is categorized into four sections:
📊 Statistics – The note’s first part analyzes daily market data: highs/lows, internals, daily sector leaders & laggards, winning and losing streaks, how the market closes every day, and the S&P 500 vs. key moving averages and breadth.
Seeing each one of these data points on the same table across multiple weeks reveals trends, sometimes before a shift is evident in the charts.
🧠 Market – The report’s second category is the meat of our broad market analysis. This includes studies, various S&P 500 charts, sentiment, breadth, indicators and a pattern tracker – a very helpful tool in determining our overall market stance.
🧭 Key ETFs – We showcase a handful of actionable charts from our 175 ETF universe in this section — potential breakouts/breakdowns, ETFs near important support/resistance zones and various other noteworthy setups.
📈 Chart Trades – Here we provide trade ideas based on individual stock charts. We categorize each idea so clients can easily understand the strategy. We also relay specific entry and exit levels, which presents a clear framework.
These sections used to be separate notes, which we’ve since combined so all premium clients get a true understanding of our process and are best equipped for each trading day.
Today, we’re sharing the first two sections of today’s Opening Look.
Have a great Tuesday. Best, Frank
Intra-Day
The intra-day chart says it all — Monday was a classic gap, hold, and extend session. The only noticeable dip occurred mid-morning, but when that failed to trigger a momentum shift, the bid returned and the rally resumed.

Daily Price Action
The SPX’s 3.3% pop was the best gain since the 9.5% spike from 4/9 – both clearly triggered by positive tariff news. It also was the second biggest gain since 11/10/22. We have to go back to March and April’20 after that to find a bigger move.
The index’s 81% advancing stocks were the most since 91% on 5/2, as well.

Sectors
Consumer Discretionary and Tech were the clear leaders on Monday, which was evident via both market cap and equal cap sector ETFs. The Materials sector quietly had nearly 100% of its holdings advance, as well.
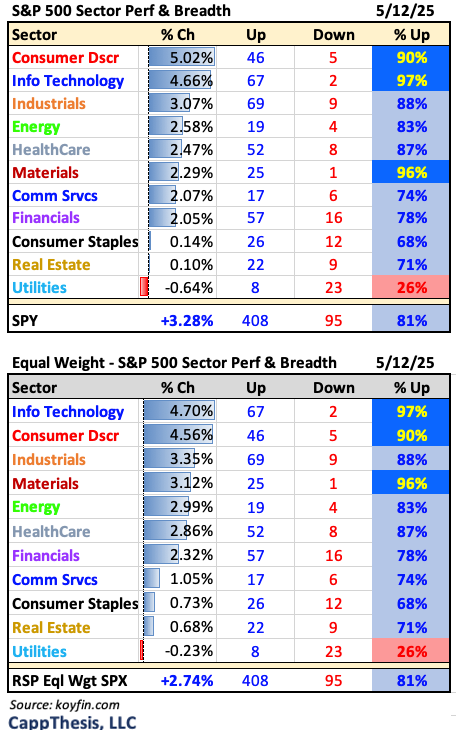
Breadth
Breadth was extremely positive across the board on Monday, with Small Caps doing the best.

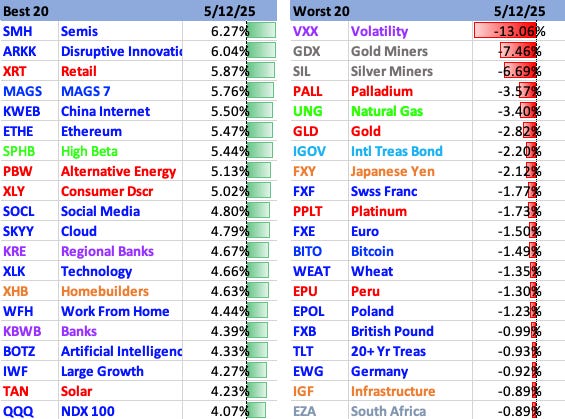
Best & Worst 20 ETFs
It was pure risk on, with Growth dominating our ETF leaderboard. Vol, Bonds and Metals lagged – no surprises.
The 200-DMA
The SPX shot through its 200-day moving average yesterday, along with several other key resistance lines. That’s a critical step—but now it must hold above those levels.
Remember, the index reclaimed the 200-DMA three different times in early 2022, but none of those holds lasted. All eyes are now on how well the SPX respects the 200-day line during the next bout of selling.

Short-Term
Needless to say, the spike pulled the SPX’s 14-period RSI on the two-hour chart back above the 70-mark. While the indicator grazed the overbought zone two weeks ago, this was the first full-day close above it since late January. It took a significant move to generate this condition—reflecting the severity of the preceding decline.
That’s a very constructive sign going forward. A key feature of the uptrends in 2023 and 2014 was the RSI frequently reaching overbought territory on shorter timeframes. It never lasts long, but the goal now is to see a healthier pattern of higher highs and higher lows take hold.

Looking at the same chart from a drawdown perspective, it’s clear that profit-taking wouldn’t be a shock at this stage.

The Biggest Rallies
Zooming out, the current 21% rally is among the largest over the past three years. Interestingly, the two bigger ones also began with the SPX below its 200-day moving average—just like this time. However, back at the March and October 2023 lows, the index was only marginally below that key level, so the initial pop quickly reclaimed the 200-DMA.
This time, it took five weeks of strong upside to recapture that line. That doesn’t mean the move can’t extend further, but it does suggest that a retest of the 200-DMA isn’t off the table—even if the market is ultimately destined to make new highs.

Still No 1% Declines
Meanwhile, the streak without a 1% daily decline has now extended to 15 sessions, closing in on the 2025 high of 17 sessions from late January through mid-February. The last 1% drop was on April 21. Since then, the SPX has posted five 1% gains—though only two since April 25. While this kind of lopsided tally likely won’t persist, the fact that big gains have outnumbered big losses is clearly a supportive backdrop.

Patterns
The SPX also hit its first bullish pattern target of 2025 by reaching 5,840 yesterday afternoon. That’s a notable milestone, especially considering that three straight bullish formations failed between December and February.
That leaves us with two live bullish patterns. The cup-and-handle formation with a target of 6,125…
And the new large inverse head-and-shoulders pattern with a target of 6,555, which was triggered yesterday. To keep this pattern intact, the index must hold above the 5,695 level.


On the daily action table, can you also note higher-high, higher-low, etc.