

Our 6-Step Trading Process That Powers Winning Chart Trades & Limits Losses
A simple, proven framework for identifying high-probability setups

***Please do not forward. Thank you.***
📈 Active Traders Can, In Fact, Beat the Market
Active traders can, in fact, beat the market. Sometimes by a lot. How? Every successful trader has a process or a set of rules. But that process can vastly differ per trader. The key to a long track record of successful trading is to always adhere to one’s process. 🔁
This is important to understand. Below, I discuss the process that I use to find technical analysis-based trades. This will make all the sense in the world to some readers, but not to others. This is completely normal. Healthy markets are literally created by millions of participants expressing different viewpoints via trading every single day. 💬📊
For example, two of the smartest and most successful traders I know have completely different approaches. One is a momentum trader and buys breakouts, while the other one focuses on a mean-reverting strategy looks for FAILED breakouts in order to sell or short. Yes, you heard that right. 😅 They often find themselves trading the same instrument, and sometimes, they both end up making money.
How is this possible? They have different processes, which can mean managing risk differently, caring about different time frames, using different strategies like options, etc.
📌 The point is that anyone interested in becoming a successful active trader should work to find a process that makes sense to them… and keep working at it. It’s a never-ending journey. 🚶♂️📈📉📈
My Process
We’ll keep this very straightforward and focus only on long trade ideas, i.e., technical buy setups. For those readers who prefer trade ideas on the short side, the same logic applies, just in reverse. 🔁
My process has six steps:
📍 Step 1: Determine the market’s dominant trend
📍 Step 2: Choose trading strategies based on the dominant trend
📍 Step 3: Look for trade ideas
📍 Step 4: Determine the best entry point
📍 Step 5: Set a price target and stop loss
📍 Step 6: Pay attention to step #5 ❗
📊 Step 1: Determine the Market’s Dominant Trend
There are three kinds of trends: up, down, or sideways. The S&P 500 has encountered all three from 2020–2025:
2020–2021: uptrend
Jan’22-Oct’22: downtrend
Oct’22-March’23: sideways
April’23–Feb’25: uptrend
Feb’25 - present- downtrend (so far) 📉
Uptrend
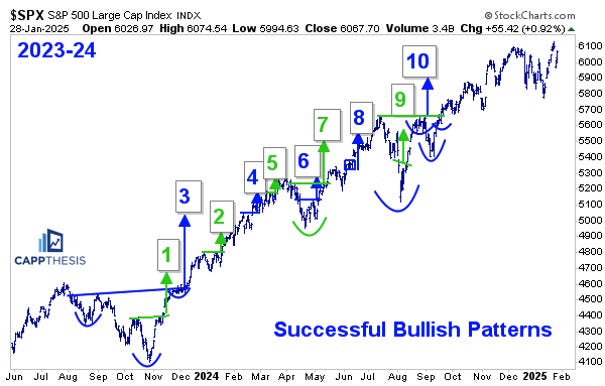
The S&P 500 alone formed 11 different bullish patterns from October ’23 to December’24 and achieved 11 upside targets. As we know, in aggregate, that produced a strong uptrend. Another key trait we see in uptrends is low two-way volatility.
We track this by paying attention to the number of ±1% moves every month. From April ’23 through June ’24, the number of big daily moves remained subdued, and breakouts worked. When volatility is low, we often see “clean” breakouts—that means when a stock breaks out, it doesn’t revisit (or negate) the breakout zone. 🚀
Downtrend
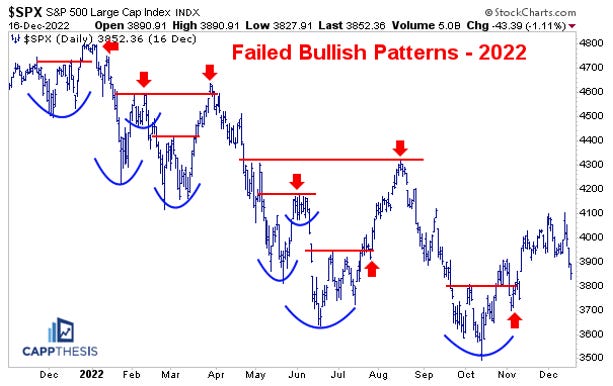
In downtrending markets, breakouts are difficult to find. When the market is declining on a continuous basis, it’s characterized by frequent large moves—both on a daily basis and over weeks and months. In 2022, for example, the SPX logged 128 absolute 1% moves: 65 declines and 63 gains. Two-way volatility was fierce.
When that happens, tight consolidation phases simply don’t take shape often. And when they do, the breakouts that stem from them are negated because the whipsaws are so severe. We can see how many sharp rallies failed just as potential breakouts were about to occur in 2022.
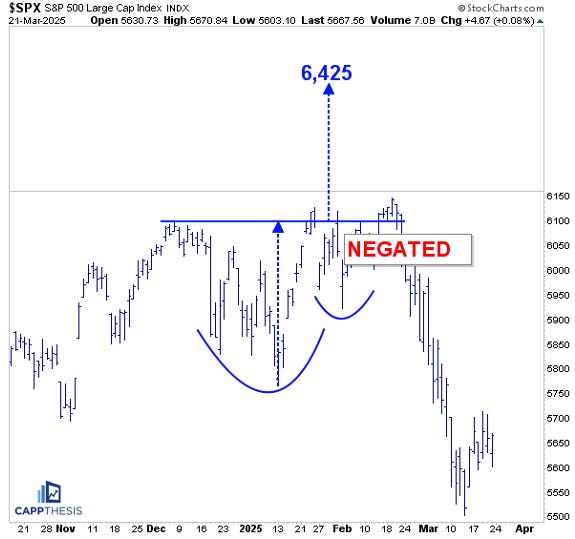
🔀 This has been taking place in the latter half of Q1 2025 again, which became crystal clear in late February when this large bullish cup and handle pattern was negated.
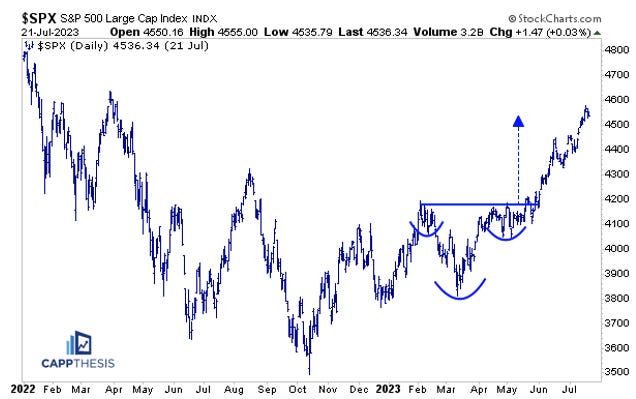
Sideways
The most recent sideways phase encompassed the price action from Q4 2022 through Q1 2023. Indeed, the bear market was still in play through the first part of that period, and the new bull market had already begun toward the end of it.
But the number of big moves continued, which made for a treacherous trading environment. However, in April ’23, the number of 1% gains and losses suddenly stopped, giving way to the calmer trading environment…
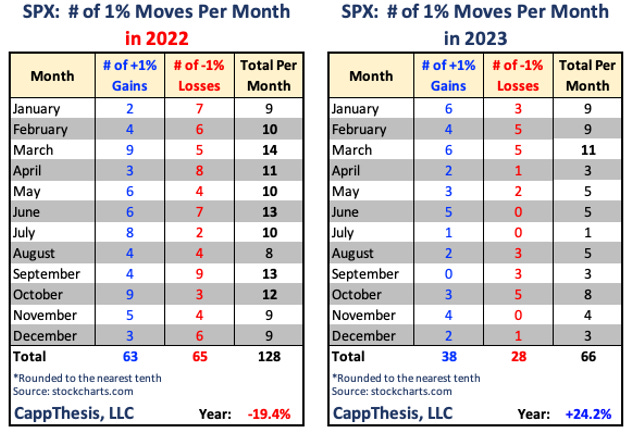
…that supported breakouts and gave way to the long uptrend that followed.⚡️
🧠 Step 2: Choose Trading Strategies Based on the Dominant Trend
So, after establishing what the dominant trend is, we then need to choose the best suited trading strategies.
In uptrending markets, two types of buy setups work:
Buying bullish pattern breakouts 📈
Buying dips in long-term uptrends 🛒
In downtrends and sideways trading environments, the best kind of long trades are:
Buying oversold stocks near support 🧨
Those have been difficult to find over the last two years, but given the big declines we’ve seen in various growth stocks since late February’25, these kinds of trades may prove popular in 2025 again.
🔍 Step 3: Look for Trade Ideas
This is where it gets interesting since the question is always, “Where do I even begin?”
I look for trades in various ways. One method is to use a stock screen service. There are countless scenarios one can choose from, but a good starting point is screening for stocks trading above key moving averages like the 200- and 50-day moving averages. Regardless of the parameters chosen, that’s only part of the process.
📊 Technical analysis is both a science and an art. The science part is using technology to help narrow the amount of potential trades down from the thousands of publicly traded stocks to a more manageable amount. From there, it becomes an art. The setups that I choose to trade have to pass the old-fashioned eye test 👁️.
For instance, when the market experiences a big decline, I often look at the stocks that bucked the trend and actually advanced that day. Sometimes this reveals certain stocks in the same group showing relative strength and/or displaying bullish characteristics. 💪📈
🎯 Step 4: Determine the Best Entry Point
🧮 Step 5: Set a Price Target and Stop Loss
⚠️ Step 6: Pay Attention to Step #5
We’ll review steps 4–6 together and go over real trade ideas that we provided to CappThesis clients over the last year. Given that the dominant trend had been higher through early 2025, the trades discussed below were bullish pattern breakouts and buying dips in long-term uptrends.
For bullish patterns, this is pretty straightforward. We buy the breakout. On most trading applications, the buy-stop order type allows you to buy a stock as it crosses above a certain price level. Notice that step four says “best” entry point, not “lowest” price level. I have no interest in buying a potential breakout while the stock still is below a key supply zone. We’ll see why in a second. ⏳
📝 Recent Trade Ideas
Here are two bullish pattern breakout trades that worked well.
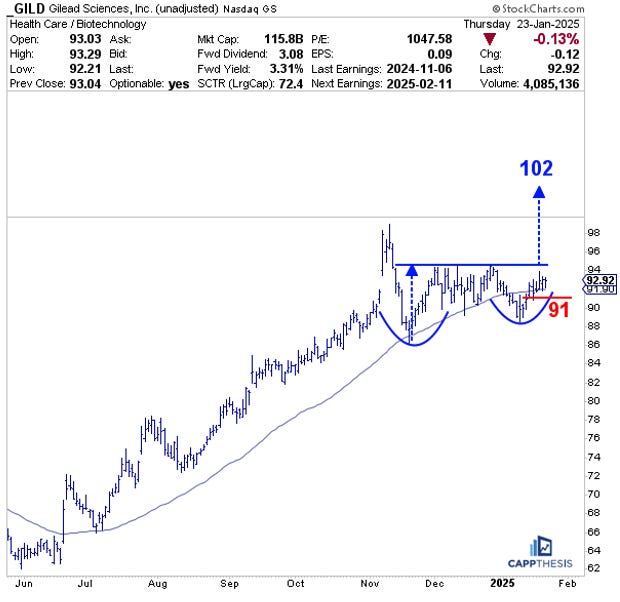
We recommended GILD on the morning of 1/24/25 with a target of 102 and a suggested stop of 91. Why 91? Breaking below that level would have negated the structure of the cited bullish pattern. The italicized entries below are excerpts from our premium reports:
“Biotech stocks have had a wild ride over the last few months, too. GILD has been one of the best within the group since November, managing to hold near its 50-day moving average after the post-election dip. And because it did, the stock now has formed a potential cup and handle formation. A breakout above the resistance line (just below 95) would target the 102-zone..”
Here’s the chart as it appeared in the report…
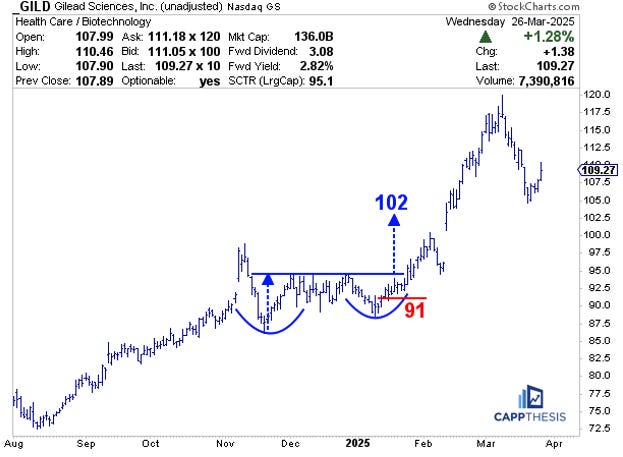
📈 …and how it looks as of late March’25:
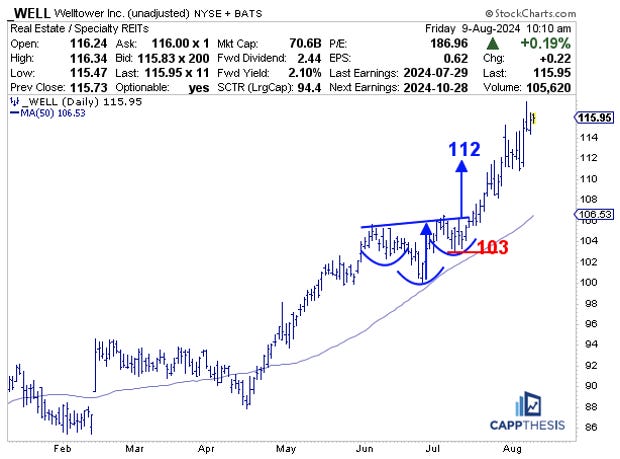
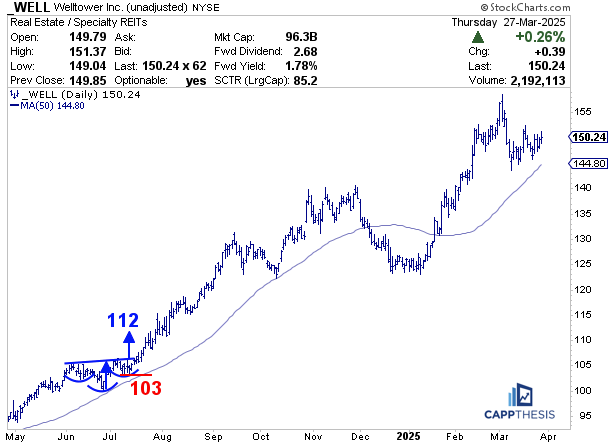
Back on July 16, 2024, WELL – a REIT name – was a long idea:
“WELL has come back after the June decline, bouncing near its 50-day moving average. It’s now constructed this potential two-month upward sloping inverse head and shoulders formation. A breakout would produce a measured move up to 112.”
💥 …and here is how it looks through late March’25. It hit that target within two weeks and has kept going. This also shows how successful bullish patterns lead to long-term uptrends.
A Failed Breakout
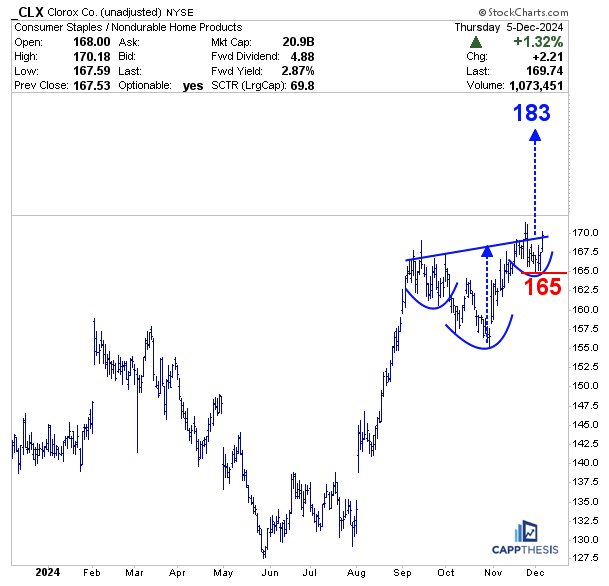
Of course, some bullish patterns DO NOT work that well even when the market is in an uptrend. We showed this potential breakout in CLX on 12/6/24, right before many defensive stocks as a whole began to falter:
“I didn’t intend to recommend a consumer staples stock today, but in going through many candidates yesterday, their patterns stood out. It’s not that other stocks won’t go up from here – as we know, most have been moving higher and remain in uptrends. But the ones that have been going up the most lately haven’t taken a breather, which means they need to eventually digest those gains to actually form new constructive patterns.
…CLX is in a long-term uptrend, but it has come off its autumn highs and now has backed and filled over the last few months. That bout of consolidation has produced an inverse H&S pattern, with a target up near 183. The suggested stop loss is the pattern’s right shoulder.”
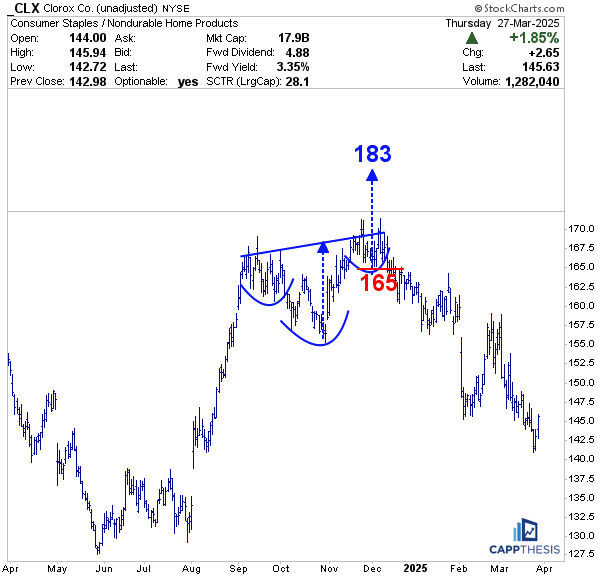
❌ CLX never even got to the breakout zone, so being patient would have prevented us from buying it. But even if we did, we would have been stopped out early in the aggressive decline.
📉 Buy the Dip in a Long-Term Uptrend
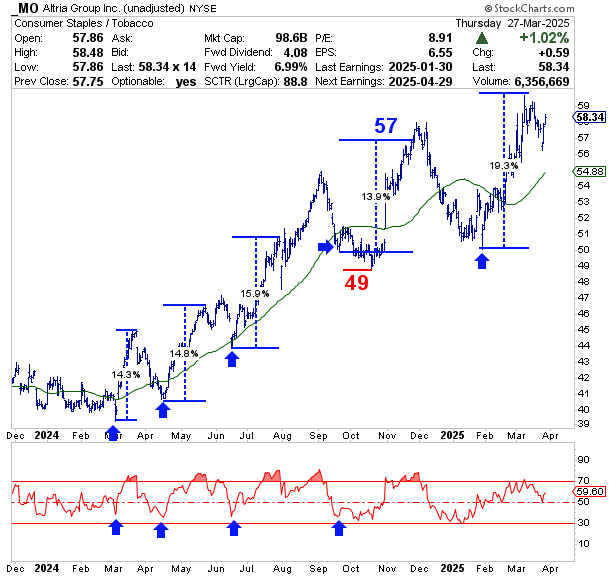
Here’s an example of buying a stock (MO) that got hit hard but remained in a long-term uptrend. Here’s what we said about it on 9/23/24:
“MO just dropped a quick 9% from its most recent 9/5 high. This pulled the stock below its 50-Day moving average and knocked its 14-day RSI down to the low-30s.
That combination eventually created favorable mean-reverting setups the last three times, with rallies of 14%, 15% and 16% following in March, Apr-May and June-July, respectively. If the same kind of behavior is repeated this time, a +14% trough-to-peak move would yield a target near 57. 🎯”
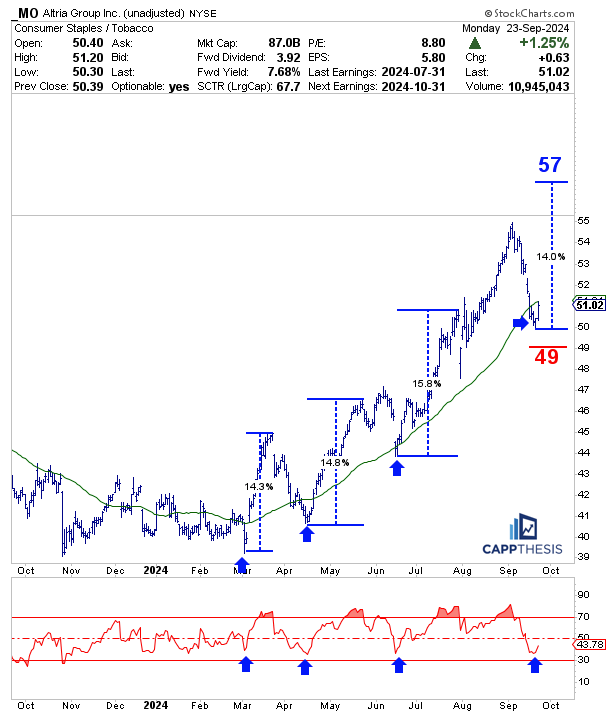
📈 Here’s how MO has done since then. As we can see, the pattern has continued to play out: MO sold off soon after hitting 57, made another higher low and the next up leg then materialized.
Three Acceptable Outcomes
There are many other examples.
The bottom line is that at CappThesis, we provide a handful of chart-based ideas like these every week. With so many potential trades to choose from, we’re okay with the following outcomes:
✅ Big gain
🟢 Small gain
❌ Small loss
Aside from an unpredictable micro or macro event, we aim to avoid big losses. No matter how experienced a trader is, we all can use technical analysis to manage risk in this way.
Taking it a step further, coming up with your own process—using technicals or anything else—could very well help you become a more profitable trader, as well. 💡📊
Great post, Frank. The emphasis on risk management is key. Thanks for sharing this!