


Thank you for your continued support throughout 2025. We officially launched the CappNotes newsletter on Substack this past March, and it’s been one of the most rewarding decisions I’ve made in the three years of building CappThesis.
This is a special community, and I’m grateful for the trust you place in this work. I’m looking forward to sharing even more thoughtful content and perspective with you in the year ahead.
Wishing you and your families a happy, healthy New Year. Best, Frank
📈 S&P 500: The Last Pattern Breakout of 2025
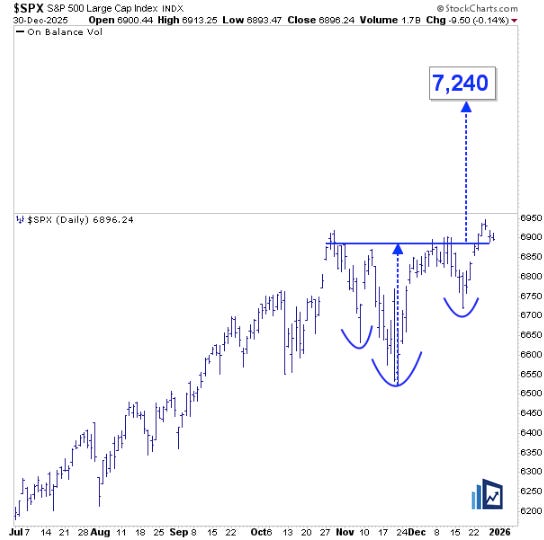
Despite the three-day losing streak, the S&P 500 ended Tuesday still above its breakout zone near 6,880. It first cleared this level a week ago on December 23.
As is often the case, an initial pullback toward a breakout area is normal, and even some additional near-term profit-taking would still be entirely consistent with a constructive setup.
Importantly, the pattern remains live, with an upside measured-move target near 7,240. This version of the structure resembles an inverse head-and-shoulders pattern with a horizontal neckline — one of the key scenarios we outlined last week.
🔁 The Other Version: Cup-and-Handle
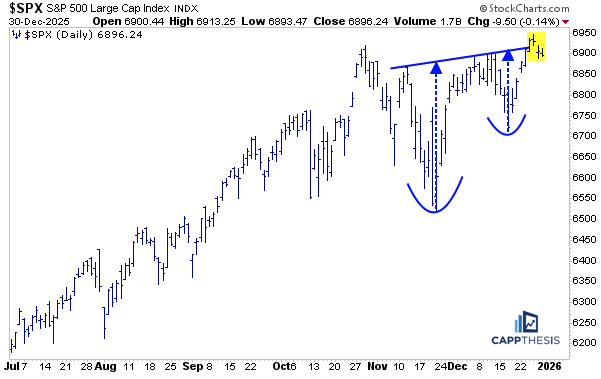
The other interpretation of this structure looks more like a cup-and-handle pattern, as it connects the series of highs since November more effectively.
Because those highs have been progressively higher, the resulting trendline slopes upward — meaning only modest additional follow-through would be required to trigger this version of the breakout.
Ultimately, these are simply two ways of visualizing the same underlying setup: the S&P 500 attempting to resolve higher from a major bullish pattern after working off the elevated volatility that defined much of the fourth quarter.
🧠 Why Pattern Behavior Still Matters
This is an important moment — not just because we’re closing out 2025 and entering a new year, but because it offers insight into how well bullish pattern breakouts continue to work.
As we know, breakout success rates are one of the most important metrics we track, helping us gauge both the strength of the underlying uptrend and our confidence in that trend extending further.
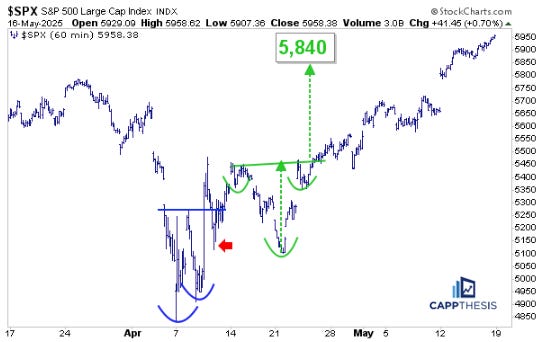
Taking a step back, this is the chart we first highlighted in mid-April. Even during highly volatile environments, our focus remains on identifying bullish structures as they form.
The initial attempt (shown in blue) lacked the consistency needed to hold, with the failed cup-and-handle formation (red arrow) unfolding during the height of the tariff tantrum.
🔄 When the Right Pattern Sticks
Shortly thereafter, a second version emerged (shown in green), and this one proved far more reliable.
That breakout held its first test within a week, gained traction, and led to a more sustained advance — with the 5,840 upside target achieved within three weeks. From there, multiple bullish formations followed, with measured-move targets consistently being met.
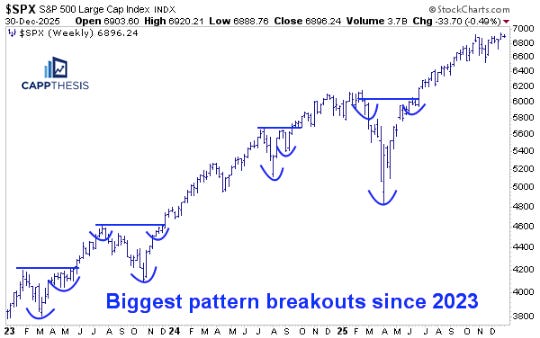
Eventually, one of the largest bullish patterns of the past several years took shape, incorporating price action from the start of the year and the subsequent recovery.
At the time, we discussed how — if prior iterations since the 2023 low were to repeat — a much larger bullish formation could trigger, opening the door to meaningful upside follow-through and significantly higher targets.
What once seemed far-fetched ultimately played out — and then some.
🚀 Setting Up the Next Advance?
Now, after digesting the past three months of price action, the S&P 500 once again has the potential to extend higher from another large bullish formation.
If this pattern continues to work, it sets the stage for a renewed advance as we move deeper into the new year.
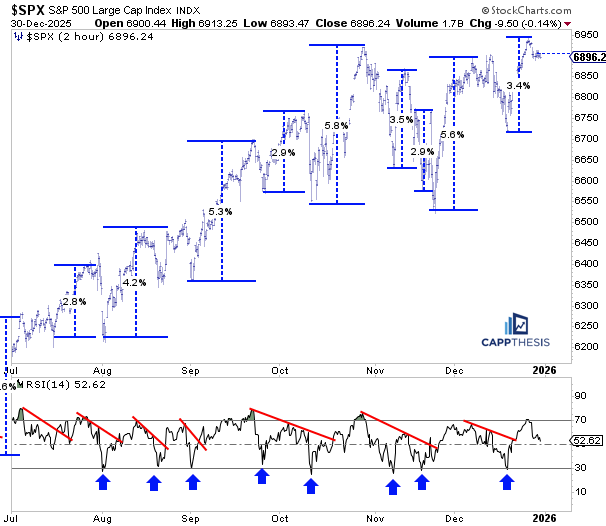
⏱️ Short-Term View: Controlled Reset
Zooming in, the short-term setup tells a constructive story.
The key objectives were to see whether the latest bounce could:
Produce new highs — which it did, and
Trigger the first overbought reading on the two-hour chart since late October — which also occurred.
As a result, the subsequent pullback has been non-damaging and unsurprising, with the indicator resetting from overbought and now hovering near its midpoint.
Given the low-volatility backdrop and light holiday volumes, we’re not placing too much weight on this move.
That said, we’ll continue to closely monitor this short-term measure, as it has been one of the most effective tools for tracking the market’s ebb and flow throughout the year.
Great analysis
Thanks Frank. Happy healthy 2026. It seems we gave up all the gains from the breakout/ Santa Claus rally and then some…. And to be sure, the 7240 target is your next near term target and not a 2026 target right ?