

S&P 500 Pullbacks Are Changing. What’s Different Now?
Momentum note & my latest StockCharts TV video

Good morning - I recorded this video on Tuesday, and everything discussed is still relevant today.
In addition, here’s a blurb and chart from this morning’s Opening Look note.
RSI – Momentum is Still Weak
One of the most instructive market tells over the last few months has been the negative divergence in the 14-day RSI. Since mid-September, the momentum indicator has been making lower highs even as SPX continued to post higher highs into mid-January. The index’s uptrend lines and the RSI’s downtrend lines make that disconnect very clear.
A major reason this was able to persist for so long was that large-cap growth began to underperform in the latter stages of Q4. At the same time, the rest of the market experienced strong rotation, and that broader leadership provided a solid enough foundation for the market to stay elevated and continue making new highs.
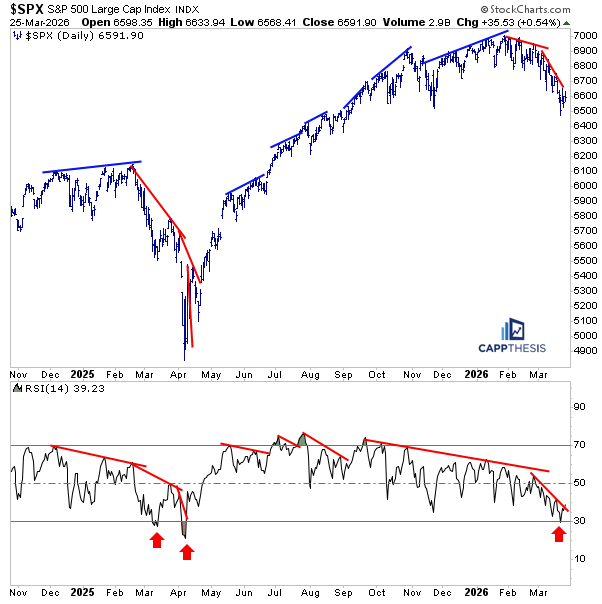
But when the bullish pattern we had been tracking failed to generate the demand needed for a meaningful breakout, the market began to slip. We can see that with the red downtrend lines on the SPX’s chart; at the same time, the RSI kept rolling over and recently just reached oversold territory for the first time since last April.
We are showing this because it is similar to what happened last year. The RSI topped in December 2024, while the market continued to grind to marginal new highs into February before eventually rolling over. These trend lines also help show that momentum matters. It does not always lead to an immediate breakdown, and divergences do not always work. But when they do, they can provide an important warning sign.
As of now, there is still no lasting signs of momentum swinging back to positive, with the RSI continuing to make lower highs over the last few weeks. At some point, that will have to change. We saw a version of this in 2025, when the first oversold RSI reading in early March led only to a failed mean-reversion rally, and then a second, more powerful down leg pushed the RSI into the low 20s and ultimately marked the low.
Every cycle is different, but this remains an important blueprint to follow. Even though the decline hasn’t been as severe this time, we still need to see a similar shift in behavior before assuming the worst is over.
From StockCharts:
“Frank analyzes the S&P 500 after a key shift in market behavior, with recent pullbacks beginning to act differently than earlier in the year.
He reviews the first successful bearish pattern in months, the breakdown from a multi-month trading range, and the importance of hitting downside targets.
Frank also examines weakening dip-buying behavior, the rise in volatility with frequent 1% moves, and the continued series of lower highs.
With momentum indicators deteriorating, breadth under pressure, and fewer strong closes, the focus now turns to whether the market can stabilize and form a new base or if downside risks will continue to build.”
00:00 - Welcome
S&P 500 $SPX
00:24 - Bearish Patterns
02:40 - Potential Bearish Patterns
03:33 - Bullish Patterns
04:41 - Trading Boxes
2026 vs. 2025 S&P 500 $SPX
07:50 - Drawdowns & the 200-DMA
09:44 - Two-Way Volatility
15:09 - $SPX & $VIX
GoNoGo
16:08 - $SPX Daily
17:27 - $SPX Weekly
18:06 - $SPX Short-Term, Breadth
20:03 - $SPX Bad Closes
See comparison of last year’ trend to this year’s trend…eerily similar… see my post today .. NDX trend
====
https://uvc9876.substack.com/p/unveiling-ultimate-unique-universal?r=58xvw2&utm_medium=ios
====