SIX SPX Charts
I was traveling the last few days on business but paying close attention to the continued market gyrations. Here are six important SPX charts to monitor over the short-term.

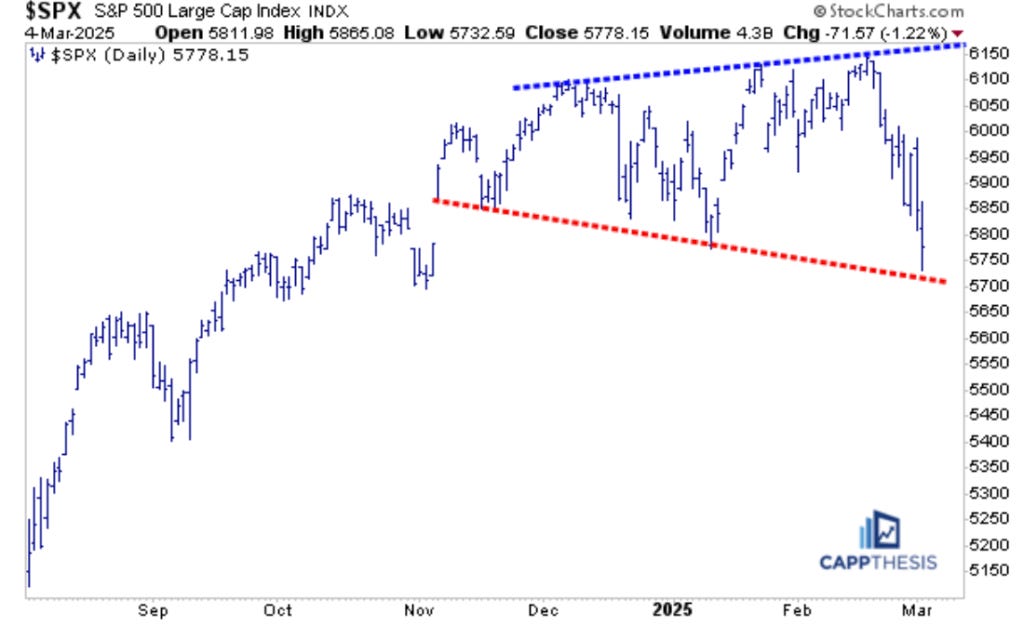
Broadening Formation
Tuesday’s weak open pushed the SPX below its January low, marking the first true lower low since then. Back in January, we saw both a false breakdown near 5,750 and a false breakout above 6,100, which, together, helped form a broadening pattern. While upside follow-through had been lacking, the index stayed relatively close to its multi-month highs—until the last two weeks. Now, after a 6% sell-off, the index has fallen back to the bottom of the broadening formation.
This pattern, when formed after a strong advance, is considered bearish – erratic trading after a preceding, calm uptrend connotes indecision at best – an inflection point (lower) at worst.
The longer it persists, the more its boundaries expand. If we continue to see higher highs and lower lows, the pattern, itself, will lose relevance.
For now, with the SPX near its lower boundary and many indicators flashing short-term oversold, it could finally set the stage for a rally that actually lasts longer than a few hours.
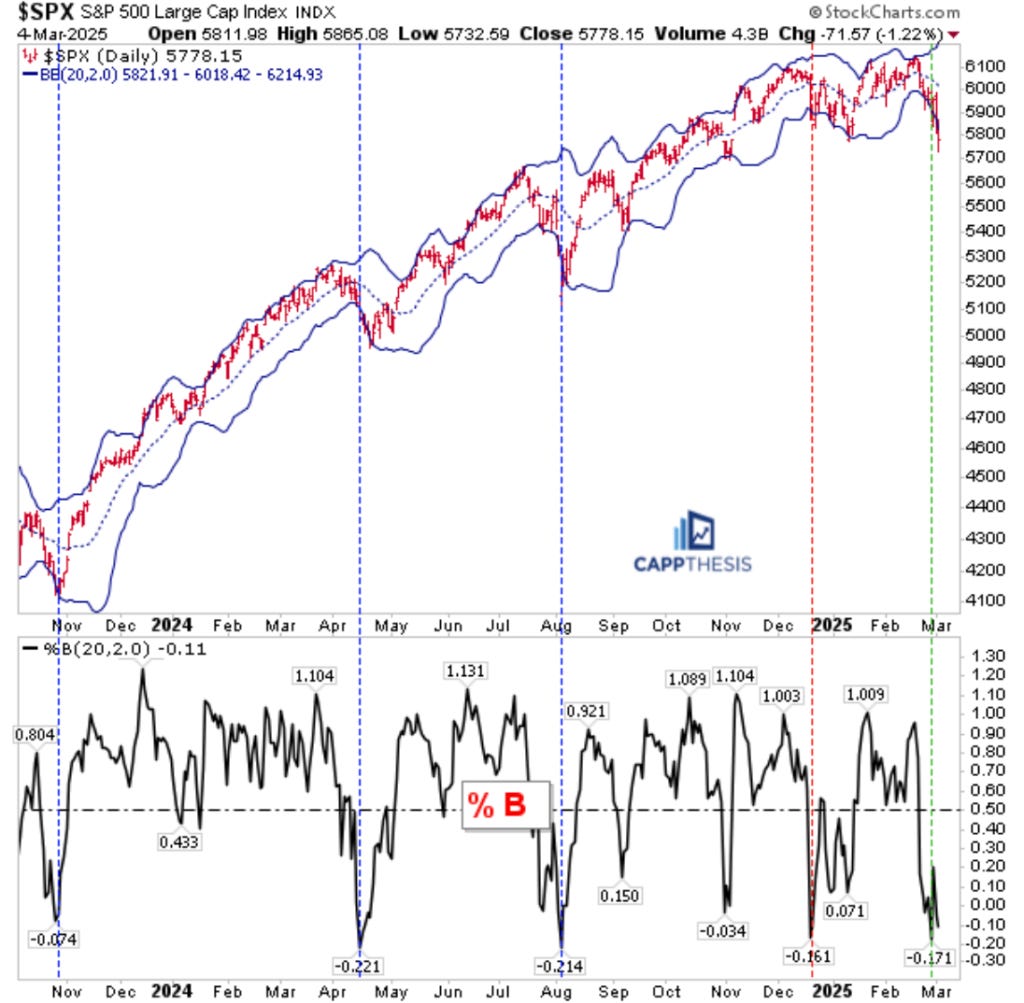
Bollinger Bands %B
The recent price action has pushed the SPX below its lower Bollinger Band again, after flirting with it for the past week. Extreme short-term declines often lead to a depressed %B reading, which has occurred once more. (%B compares the SPX’s last price to the upper and lower bands.)
The last four lowest %B readings have effectively marked trading lows, though not always immediately. In particular, the last instance in December prompted two rallies but both were quickly faded. Those pullbacks, however, produced only marginal lower lows, setting the stage for a third attempt —which finally worked.
Similarly, the %B was even lower just a few days ago, suggesting a tradable low could be forming. Now, the key is seeing real upside follow-through, much like what happened in mid-January.
So, while an extremely low %B indicator hasn’t been a perfect timing tool, it has been a reliable short-term gauge of oversold conditions.
Weekly Bollinger Bands
An important long-term chart to watch now is the weekly Bollinger Bands, as the SPX has hit the lower band for the first time since October 2023.
Historically, sticking with the trend until the weekly lower band is touched has been a reliable strategy since 2017, as strong uptrends rarely test the lower band. And when it does come into play, it often marks key trading lows—just as it did twice in 2023. That’s an encouraging sign for the current setup…
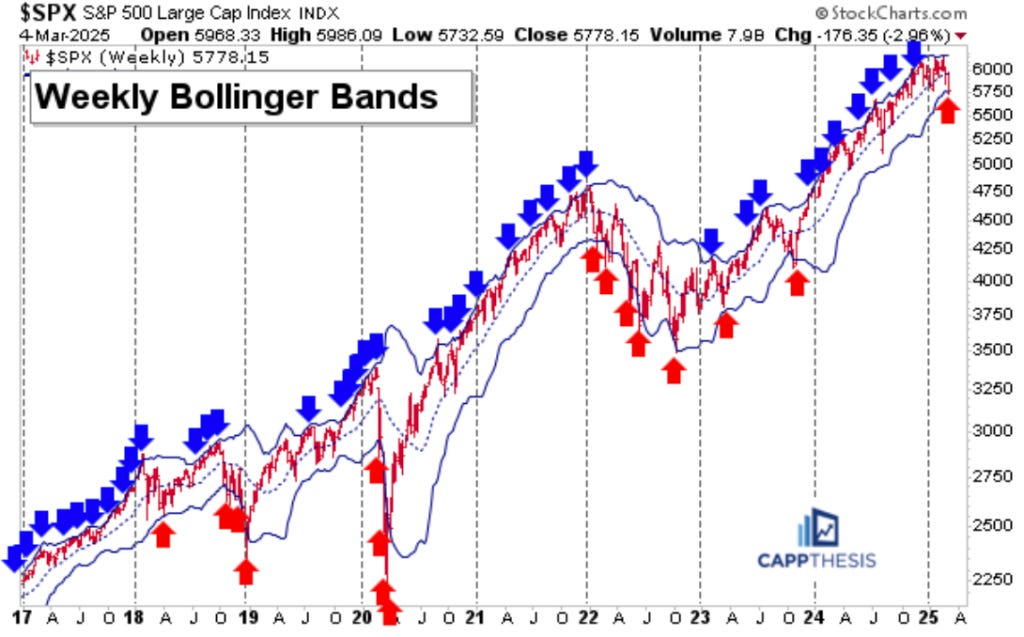
The risk, however, is that this marks a shift in market character instead. The last time the SPX hit the weekly lower band after an extended run was in early 2022, and it continued tagging the lower band for months. Also, the index didn’t hit the upper band again until Q1 2023.
So… the SPX now is oversold from both a daily and weekly Bollinger Band perspective. If the next bounce gets faded quickly and the lower bands on the different timeframes keep getting tested, it will reveal a lot about investors’ collective risk appetite.
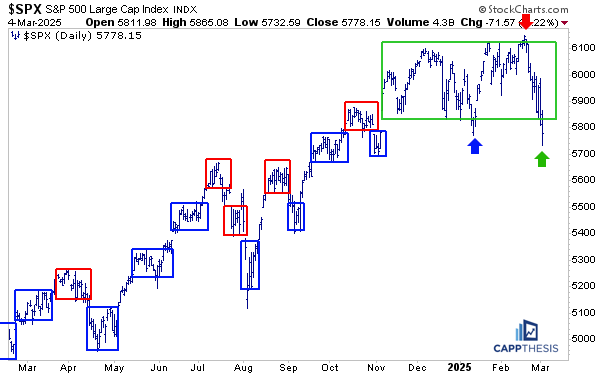
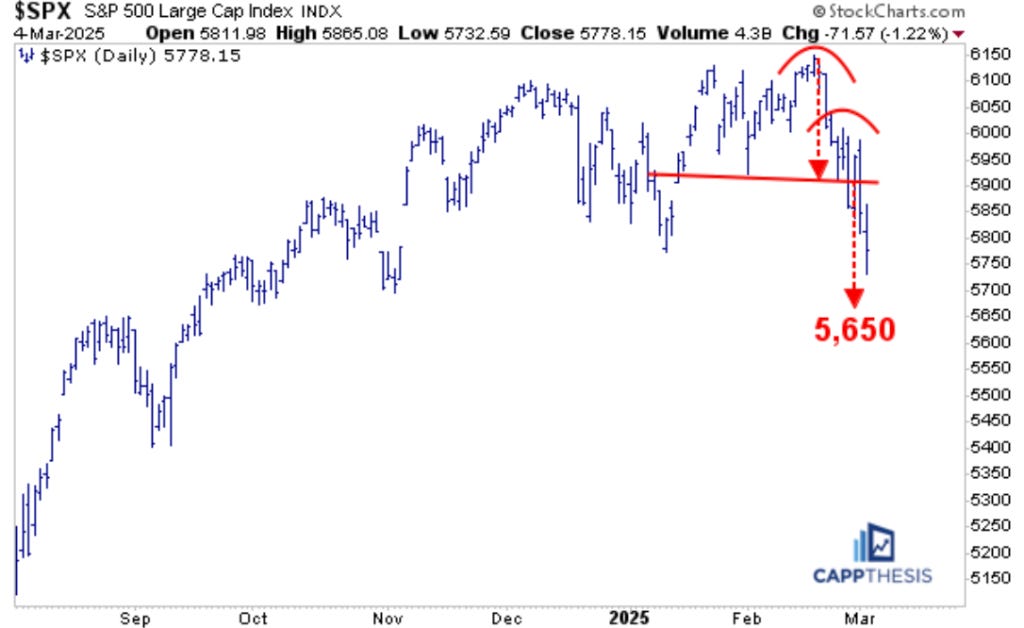
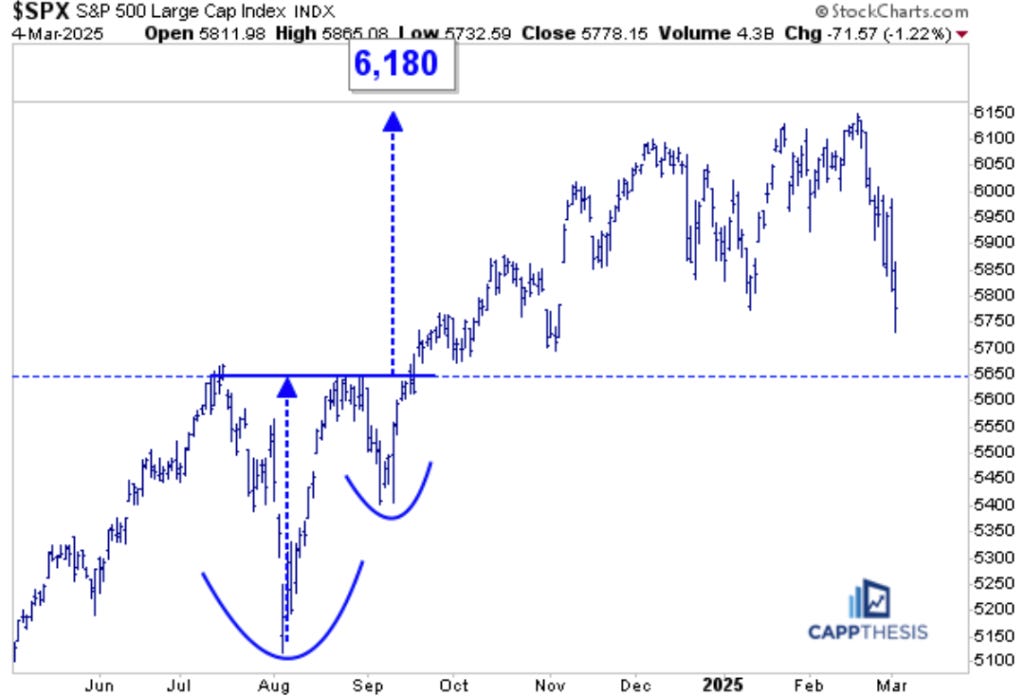
Patterns
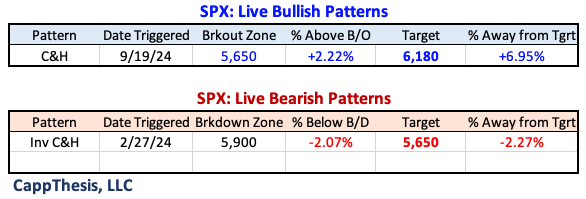
With yesterday’s 1.2% decline and terrible close, the bearish pattern remains alive – target 5,650.
The bullish cup and handle pattern remains in play, with a target of 6,180. Coincidentally, the SPX now is about 2% away from both the bearish breakdown and bullish breakout zone (see pattern grid above).
The SPX shattered the big trading box yesterday and then couldn’t push back above it with the rebound effort being thwarted. The biggest rally and sell-off the last months started after a failed box breakdown and failed box breakout, respectively. Seeing a much better finish is a necessity now.