


Here’s a blurb from today’s Opening Look piece. Each chart is of last night’s close.
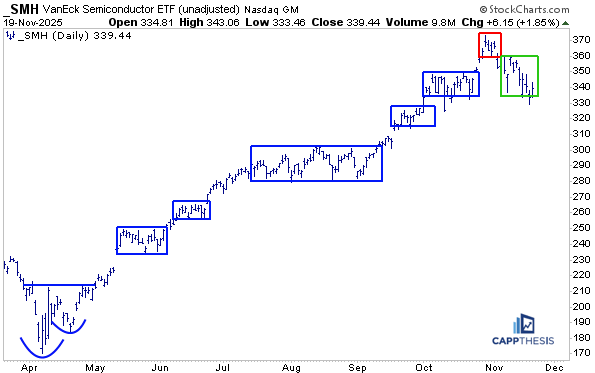
We showed this chart earlier this week with SMH teetering along the lower edge of its most recent trading box. As we’ve been pointing out, that lower boundary has acted as a pretty clear line in the sand for buyers over the past few weeks. What’s notable is that this latest trading range didn’t just appear out of thin air—it formed directly after the prior box breakdown, which shifted the short-term momentum of the move.
After that breakdown, SMH essentially reset, built a fresh range, and has spent the last several sessions respecting those new boundaries. Based on early trading so far this morning, it looks like SMH would open right back in the middle of that box.
The best-case scenario, of course, would be a push above the upper boundary of this latest range —something that would qualify as a trading-box breakout and open the door to new highs.
That’s not something we should expect today, and it’s not something the market needs to deliver immediately, but it is something that needs to re-enter the conversation soon to maintain last night and this morning’s constructive tone.
The longer SMH lingers in the middle or lower half of its range, the more the burden shifts back to buyers. Will they still interested without getting immediate gratification that was so prevalent through October?
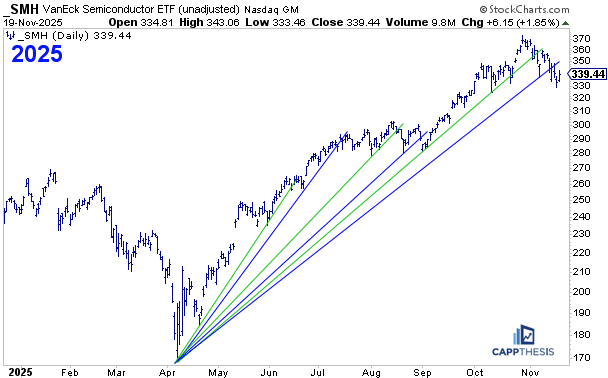
Uptrend Lines
Today, SMH also has a chance to retake its most recent uptrend line—the same line it slipped under last week. And as we’ve been noting all along, an uptrend-line break does not automatically end an uptrend. These breaks often generate more noise than signal, especially in strong moves.
What we’re seeing now is simply the latest in a series of similar undercuts. In fact, this is the sixth uptrend-line break SMH has experienced during its current advance. Every one of those prior breaks simply showed that the pace of the move needed to cool off, giving the ETF room to digest gains and reset sentiment before continuing higher.
The key now is how price behaves as it trades back into that trend line. If sellers show up aggressively and fade this pop, that would tell us the tone is shifting and we may need to reset expectations.
But if they don’t—if the market shrugs off the recent weakness and bids SMH back above that line—that would be an important sign about the path forward. In that scenario, the setup would favor additional upside and a potential retest of the top of the range sooner rather than later.
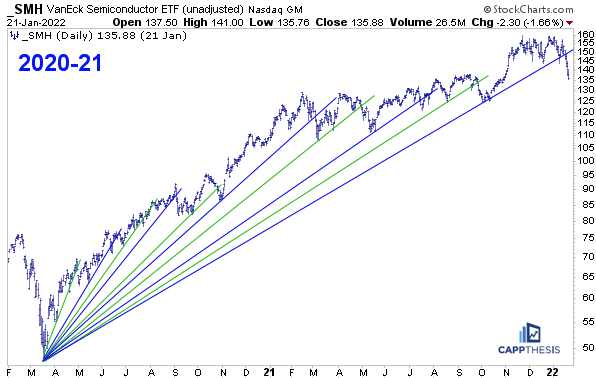
We’ve seen almost this exact pattern before:
From March 2020 through the end of 2021, SMH went through a long, powerful advance—one that included a whopping TEN uptrend-line breaks. None of those breaks derailed the uptrend. Only the final break, in early 2022, ended that 21-month run.
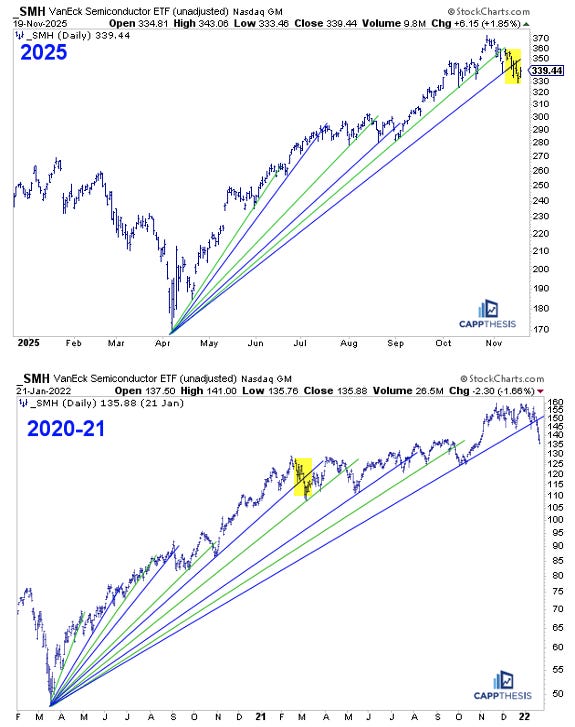
Here’s the REALLY interesting part:
Highlighted on both charts is the point where SMH broke below the sixth uptrend line—marked in yellow on each chart. It’s a very similar price setup: a new high, a quick downturn, and then, in 2021, buyers returned.
It serves as a useful blueprint for what SMH may attempt to follow now.
That last box tells it all.. dead giveaway
Love the notes
I dare to think we have one more Hurra in SMH