


The S&P 500 Just Reached Our 7,680 Target. Here’s What Comes Next.
One of the more rewarding parts of technical analysis isn’t simply identifying a pattern. It’s watching the market unfold over weeks or months and seeing whether the thesis ultimately plays out.
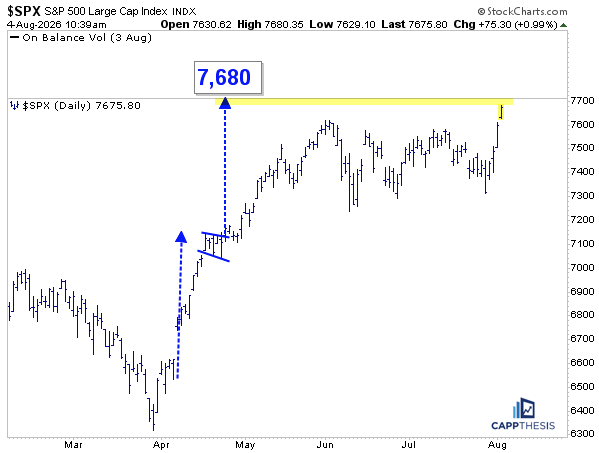
This morning, the S&P 500 finally reached our 7,680 upside target, a level first established on April 24 after a bullish flag pattern triggered. I’ve discussed this target almost every step of the way: in our daily Opening Look, during webinars, on CNBC, in multiple YouTube videos, on StockChartsTV, on X and here on Substack, too.
It took more than three months to get here.
Along the way, there were plenty of reasons for people to doubt it.
When I first highlighted the pattern back in April, I received quite a bit of pushback. Some felt the flag was too small. Others questioned whether a consolidation that lasted only a handful of trading days could really support another meaningful advance.
Those are fair questions.
But they also illustrate one of the biggest misconceptions about technical analysis: people often judge a pattern by how long it forms instead of what it represents.
A Small Pattern Can Lead to a Big Move
Bullish flags are continuation patterns.
Their purpose isn’t to predict a new trend. Their purpose is to identify a pause within an existing trend.
Strong advances don’t always require lengthy corrections before resuming higher. In fact, some of the strongest bull markets barely pause at all. Buyers remain in control, sellers never gain much traction, and even short periods of digestion become enough to launch another leg higher.
That was exactly the environment we were dealing with in late April.
The market had rallied sharply off its lows, paused for only a few days, and then broke higher once again.
The size of the consolidation wasn’t the important part.
The message behind it was.
Price Targets Measure Distance, Not Time
Another lesson from this move is one I repeat frequently because it’s so often misunderstood.
Chart patterns project price, not time.
The advance leading into the flag developed in less than three weeks.
Reaching the 7,680 objective required more than three months.
That shouldn’t surprise anyone.
Markets simply don’t move at the same speed forever. After rallying nearly 20% in roughly two months, it was healthy, and frankly necessary, for the S&P 500 to slow down. Consolidations allow momentum to cool, sentiment to reset, and leadership to rotate before another meaningful move can develop.
One of the biggest mistakes investors make is assuming that because a target hasn’t been reached quickly, the pattern must have failed.
In reality, many successful patterns simply require patience.
The Breakout Created Exactly What We Needed
When the bullish flag first triggered, my hope wasn’t that the S&P 500 would immediately sprint to 7,680.
The better outcome was for the market to build a cushion above the breakout level before entering a period of healthy back-and-forth movement.
Why?
Because consolidations serve a purpose.
They normalize stretched technical indicators.
They create additional support underneath price.
Perhaps most importantly, they often prevent larger bearish patterns from gaining traction.
That’s exactly what we’ve seen over the last several weeks.
Instead of breaking down, the S&P continued to absorb selling pressure while maintaining its larger uptrend.
Bearish Patterns Came… and Then Disappeared
One of the benefits of writing every day is that readers don’t just see the successful ideas.
They also see how the evidence evolves.
Over the past week alone, two bearish patterns briefly emerged.
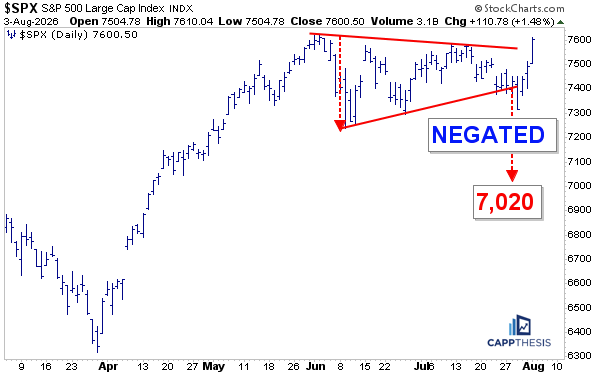
The first was a sizable symmetrical triangle breakdown that developed on Fed Day.
Another was a smaller head-and-shoulders pattern.
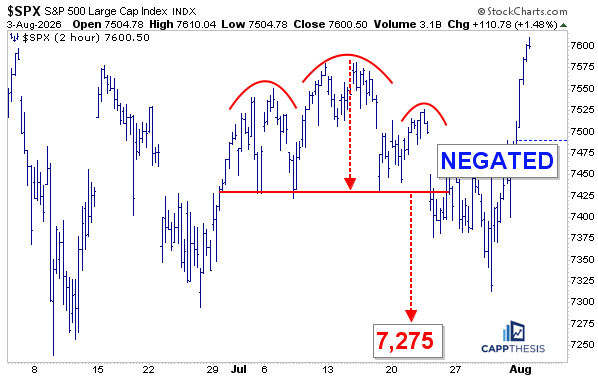
Under different circumstances, either one could have led to additional weakness.
Instead, buyers stepped back in, reclaimed those levels, and negated both patterns.
That’s an important reminder that technical analysis isn’t about becoming emotionally attached to a chart. It’s about allowing price to continually confirm, or reject, the evidence in front of us.
The Market Quietly Built Another Bullish Pattern
Because the market spent so much time consolidating after the original breakout, it also had the opportunity to construct something new.
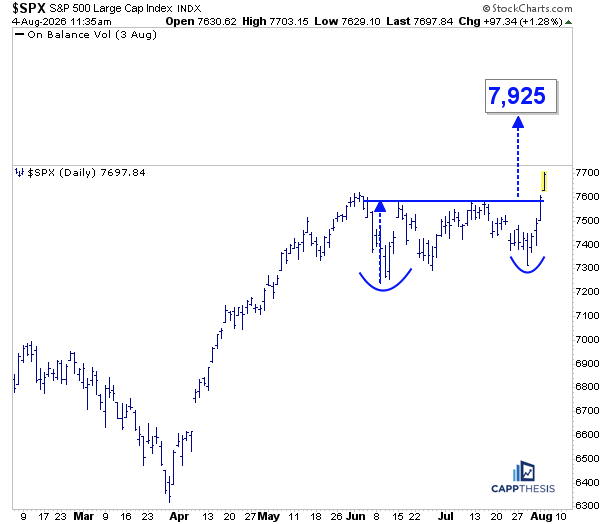
Last week’s pullback ultimately became the handle of a cup-and-handle pattern.
That pattern triggered yesterday and is seeing follow-through so far today.
Using the same measured-move approach we’ve applied for years, it now projects an upside objective near 7,925.
Will it get there?
Nobody knows.
But that’s not really the point.
Technical analysis isn’t about certainty.
It’s about identifying situations where the probabilities become favorable, defining the risk if we’re wrong, and allowing price to determine what happens next.
The Process Never Changes
One reason I wanted to share this today is because I think it illustrates what technical analysis should look like in practice.
The goal isn’t to predict every twist and turn.
It’s to develop a roadmap, monitor how price behaves relative to that roadmap, and adjust as new evidence emerges.
Sometimes patterns fail.
Sometimes they succeed faster than expected.
Sometimes, like this one, they take months to reach their objective while giving the market plenty of opportunities to build additional patterns along the way.
Today isn’t about celebrating a target being reached.
It’s about reinforcing the importance of having a disciplined process.
The 7,680 objective has now been achieved.
The market has already provided the next setup.
Now we’ll do what we’ve always done inside CappThesis: continue following the evidence, managing risk, and letting the charts (not opinions) guide the next decision.
CappNotes offers a small window into the work we do at CappThesis - a technical analysis newsletter company focused on classical chart patterns, trend, and risk management. Explore the full range of CappThesis services here:
It's great to see patient technical analysis actually play out over months instead of days.