

Good morning. Below is an excerpt from the market section of today’s Opening Look.
Also, here’s a link to a CNBC interview I did yesterday morning.
Have a very Merry Christmas!
📊 Breadth Is Leading the Way
As the S&P 500 (SPX) continues to grind higher and inch closer to its all-time highs, several other indices, ETFs, and individual stocks have already pushed decisively into new high territory.
One of the most important?
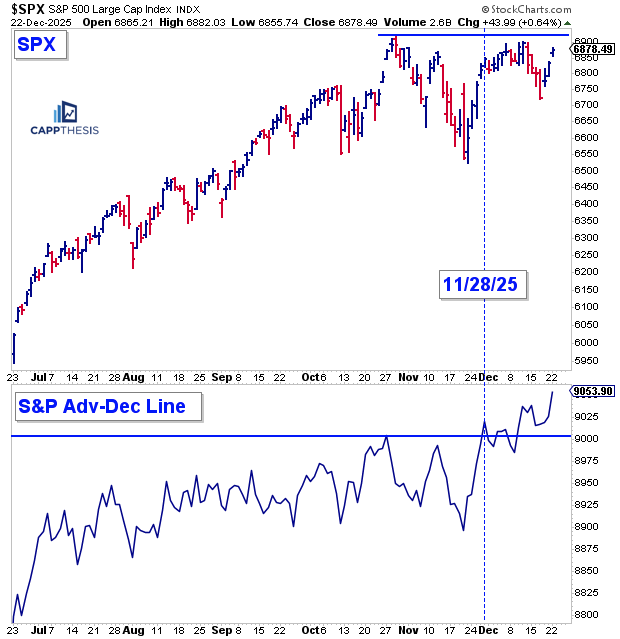
👉 The SPX cumulative advance–decline ratio, which just logged its second consecutive all-time high.
This breadth indicator first broke out on 11/28, then spent several weeks consolidating near those highs before resuming its upward march over the past two weeks.
That’s a critical development for the market’s foundation — especially as Technology has experienced increased volatility in recent sessions. Broad participation matters, and right now, it’s confirming strength beneath the surface.
⚠️ A Very Different Setup Than December 2024
It’s worth remembering how different the backdrop looks compared to this time last year.
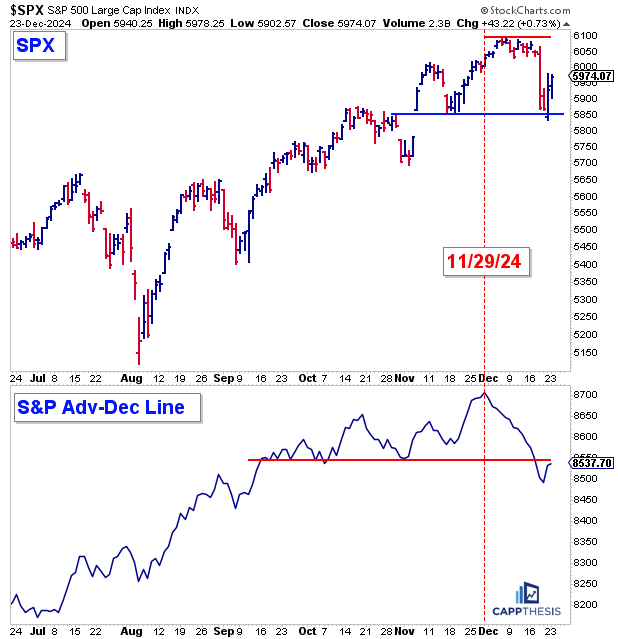
In late 2024, the advance–decline line tracked the SPX higher through much of the fall and repeatedly made new highs into November. But that strength peaked on 11/29/24 — and then the wheels came off.
What followed:
❌ 14 straight negative breadth sessions to start December
🏦 A hawkish FOMC cut that added further downside pressure
In other words, cracks were already forming beneath the surface well before tariffs or other headlines entered the picture.
That is decidedly NOT what we’re seeing today.
🎅 The Santa Claus Rally — Explained
One of Wall Street’s most closely watched seasonal patterns is the Santa Claus Rally — and despite the playful name, it carries serious historical weight.
According to Jeff Hirsch, Editor-in-Chief of the Stock Trader’s Almanac, the Santa Claus Rally is not a vague year-end bounce.
📅 It is precisely defined as:
The last five trading days of December
Plus the first two trading days of January
This definition dates back to 1972, when it was first identified by Yale Hirsch, founder of the Stock Trader’s Almanac.
📈 Why It Matters
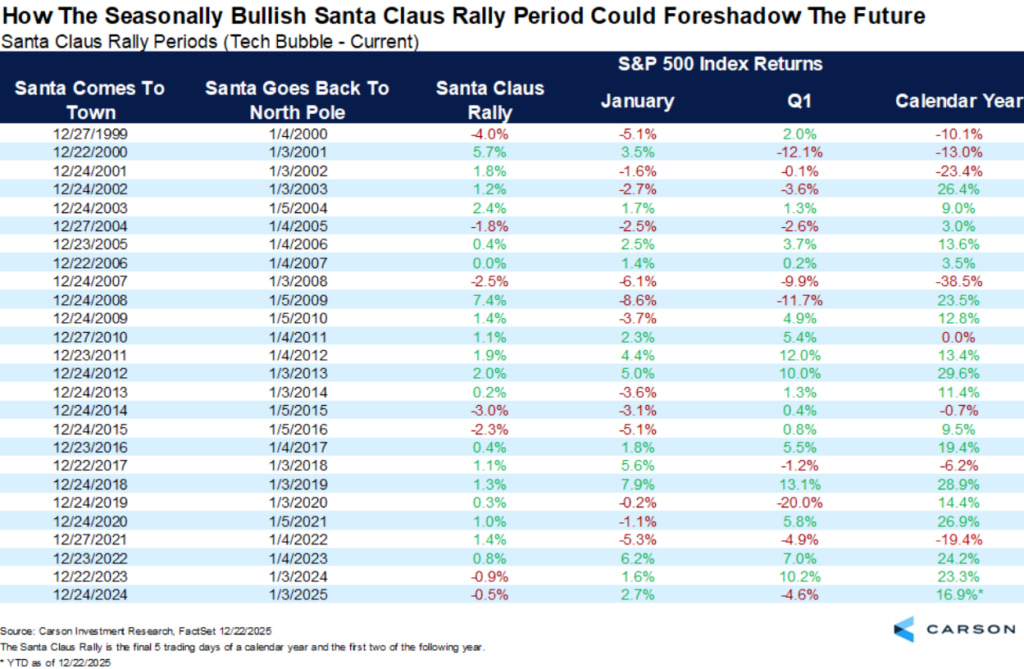
Historically, this seven-session window has delivered:
📊 Average S&P 500 gains of ~+1.3% to +1.4%
✅ A rally that occurs far more often than not
That consistency makes it one of the more reliable seasonal tendencies on the market calendar.
👉 But Hirsch emphasizes that the Santa Claus Rally is more than a feel-good stat. It often acts as an early sentiment gauge for the year ahead:
Institutional confidence
Holiday liquidity dynamics
Favorable year-end positioning
When it shows up, markets tend to enter the new year on solid footing.
When it fails, history urges caution.
As Yale Hirsch famously warned — a line Jeff Hirsch still references today:
“If Santa Claus should fail to call, bears may come to Broad and Wall.”
🧠 Bottom Line
We view the Santa Claus Rally as one data point — not a standalone signal.
But in a market driven by probability, seasonality deserves respect, especially when it’s backed by decades of data from Jeff Hirsch and the Stock Trader’s Almanac.
With breadth leading, participation expanding, and seasonality turning supportive, the market’s underlying structure remains constructive heading into year-end.
Here are the numbers courtesy of Ryan Detrick of Carson Group:
Hi frank Devil advocate here. Are we sure that we can rely on this breadth indicator in such a concentrated market. Can the 490 tail wag the 10 dog. ?
Concentration: The top 10 stocks now represent nearly 42% of the entire S&P 500’s market value, up from roughly 37% a year ago.