


TGIF. First a few links:
1-My latest YouTube video for stockcharts.com recorded this Tuesday.
2-My interview on NYSE Live yesterday.
3-Tomorrow morning, I’ll be presenting at the virtual Chart Summit hosted by Stock Market Media. The event officially kicks off this evening and runs through tomorrow.
👇Check it out:
https://www.stockmarketmedia.com/chart-summit-2026
Strong Participation Continues
The S&P 500 rallied for the fourth time in the last five sessions on Thursday, but only marginally, squeezing out a one-basis-point gain. While that did little to alter the index’s broader trend structure, it once again masked far more meaningful action beneath the surface — which remains our primary focus.
Despite the index barely moving, more than 70% of S&P 500 components advanced, marking the second reading of at least 70% participation in the last three sessions. When breadth is this strong alongside only a minimal index gain, it tells us leadership is coming from outside of Technology — from the field.
The Field Leads
That message is crystal clear in yesterday’s sector breakdowns. Nine of the 11 S&P 500 sectors finished with positive breadth yesterday, and most saw more than 80% of their components advance.
❌ Technology was notably absent from that list, acting as a drag on the cap-weighted index’s overall performance.
As a result, the equal-weight S&P 500 ETF (RSP) meaningfully outperformed the traditional market-cap-weighted S&P 500. This divergence continues to highlight that rotation — not risk aversion — remains the dominant market theme.
Trying to Hold the Breakout
From a price perspective, the S&P 500 remains in a constructive position. The 7,240 upside target is still in play, and the index continues to hold just above the key 6,880 breakout zone.
However, we are still looking for additional upside follow-through. Further strength would help pull price farther away from that former resistance area, creating a larger buffer and reducing the risk of a failed breakout.
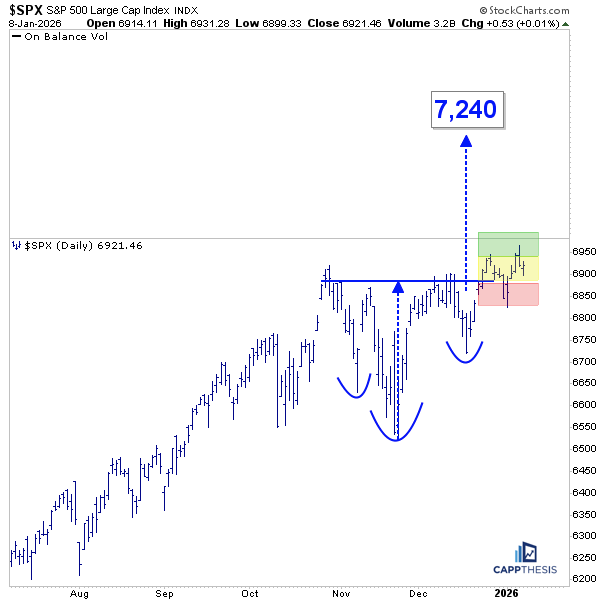
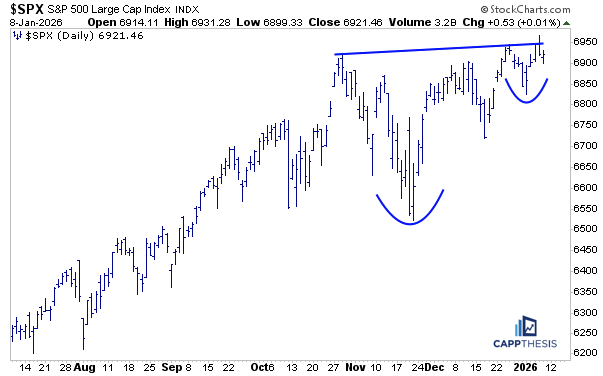
The Second Bullish Formation Still on Hold
The potential bullish formation we’ve been tracking remains viable, but it is still awaiting confirmation. A decisive breakout is needed to validate the pattern. Until then, it remains a constructive setup that warrants monitoring, but not one that has triggered yet.
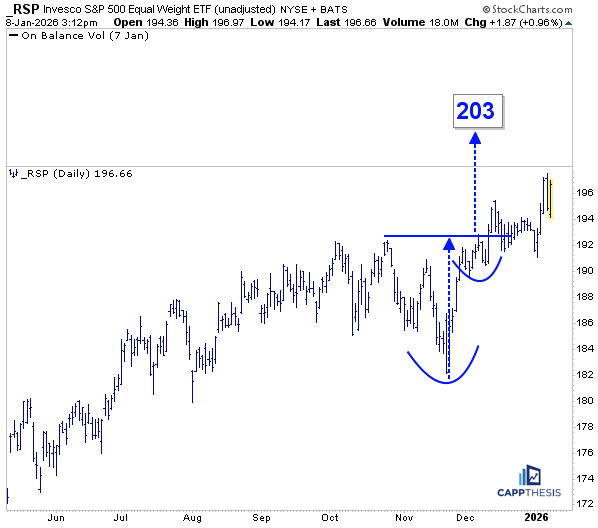
RSP Outperformance Continues
As noted above, the equal-weight S&P 500 ETF (RSP) outperformed the SPX by nearly 1% on Thursday — an unusually strong relative showing for a single session. On the daily chart, RSP continues to hold above its breakout zone near 192, which it first attempted to clear in early December.
After oscillating around that level for three to four weeks, renewed demand has emerged over the past week. This strength reflects broad participation across multiple sectors, including Financials, Industrials, and Health Care… and also Materials and Consumer Staples the last two days.
The strong overall breadth — particularly on days when Technology underperforms — RSP has been able to push back toward its former highs and is once again approaching the 203 target.
What This Means From Here
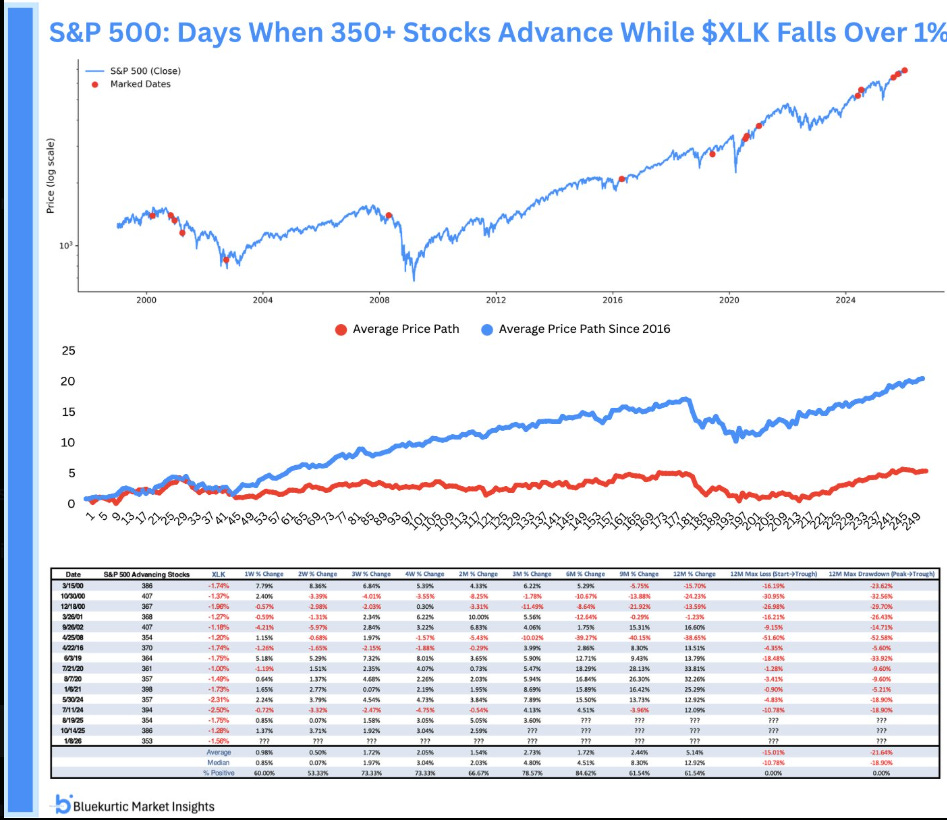
Thursday’s session was a textbook example of healthy rotation. More than 350 S&P 500 stocks advanced while XLK declined by more than 1%, underscoring improving breadth and continued risk tolerance beneath the surface.
Historically, this matters. As noted by Bluekurtic Market Insights, in similar post-2016 environments where strong participation coincided with Technology lagging, the S&P 500 delivered positive returns over the following 3, 6, and 12 months every single time.
While no outcome is guaranteed, the internal evidence continues to suggest the market is being supported by a broad foundation — a condition that has historically favored higher prices over time.
CappNotes offers a small window into the work we do at CappThesis - a technical analysis newsletter company focused on classical chart patterns, trend, and risk management. Explore the full range of CappThesis services here:
The 70%+ participation with barely any S&P movement is really interesting. That kind of breadth divergence usually signals distribution if it happens at market tops, but in an uptrend like this it more often means healthy rotation. The RSP nearly outperforming by 1% in one session is nuts though. I've been wathcing the Financials and Industrials carry weight lately, and that post-2016 comp data is compelling. The fact that Tech down 1%+ with 350 stocks up has historically led to positive forward returns makes sense when liquidity conditions are right. One thing I'm curios about is whether that 192 breakout zone for RSP holds if we see a real vol spike or if breadth participation collapses quickly.
Good take Frank: Rotation - not risk aversion - is the theme. Agreed!
But there are limits on how much higher the field can pull the market without tech which is such a massive market weighting IMO.