

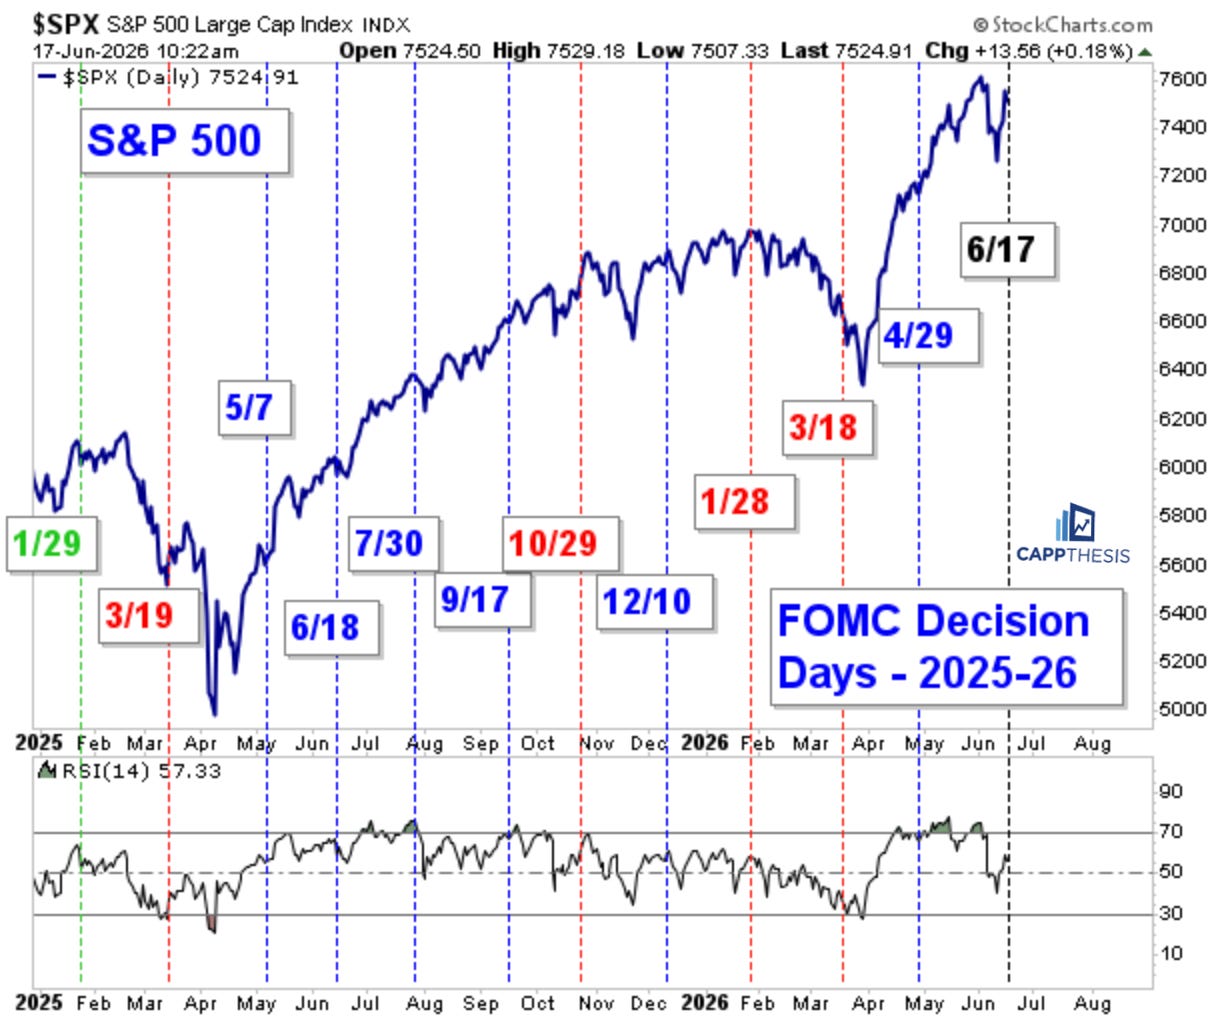
The FOMC Setup
Two very different SPX trends post rate decisions since Jan'25

Good morning - Here’s excerpt from the market section of this morning’s Opening Look note.
SPX & FOMC
It’s FOMC day, so we’re showing the chart we publish before every Fed meeting, highlighting all prior FOMC dates. The dates colored in red indicate instances when the S&P 500 was lower two weeks later, while those in blue show when it was higher. Flat outcomes are marked in light green.
The first takeaway is that today’s decision is taking place with the S&P at its highest level ever heading into an FOMC meeting. The previous meeting, on April 29, occurred in the middle of a powerful two-month advance, and the market simply continued that trend afterward.
Prior to that, however, from October 2025 through March 2026, the S&P was lower two weeks later following three of the four meetings. That period coincided with notable underperformance from technology stocks, which is clearly not the case today.
Looking further back, after the 2025 market low, the S&P was higher two weeks later following four consecutive meetings—in May, June, late July, and September. While this is not an apples-to-apples comparison, the market’s behavior from this March low has had plenty of similarities, including a sharp pivot, strong rally, and extended advance…
The major difference, of course, is that this is Fed Chair Warsh’s first meeting at the helm. Today’s statement and, especially, the press conference afterward will be closely watched and scrutinized by investors.
More importantly, however, what matters is how the market responds in the days and weeks that follow. That’s exactly why we focus on the two-week period after each meeting: it provides a clearer read on how investors ultimately interpret both the Fed’s decision, the commentary and the typical rhetoric that follows.
NDXE vs. NDX
Last night, I noticed that the NDXE (Equal-Weight Nasdaq 100) had just triggered a DeMark Sell 13, while the NDX isn’t even close to doing the same. That got me wondering: How can two versions of the same index be sending such different signals? Here’s what I found…
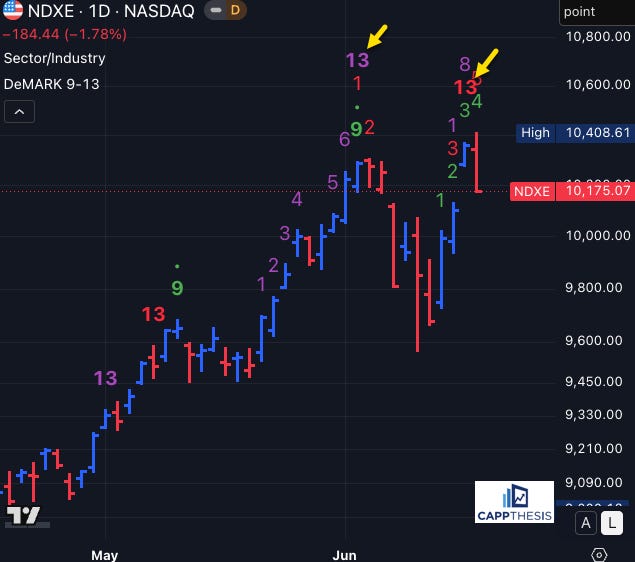
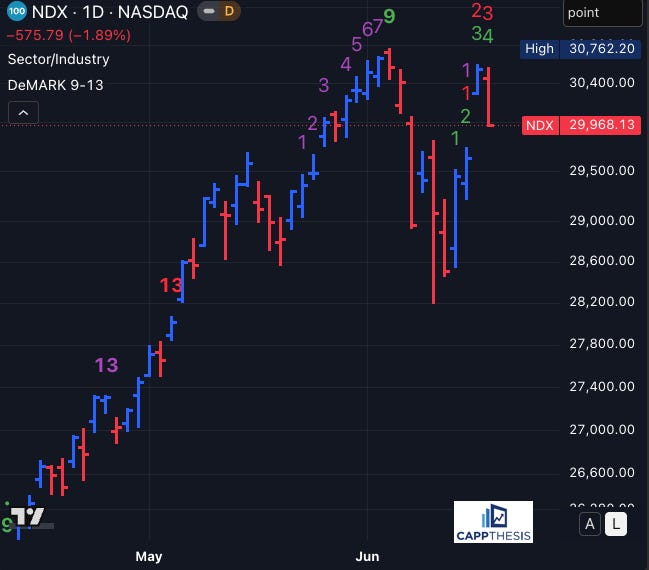
DeMark doesn’t measure magnitude. It measures cadence.
A Sequential or Combo 13 isn’t triggered by how far something has rallied; it’s triggered by…
CappNotes offers a small window into the work we do at CappThesis - a technical analysis newsletter company focused on classical chart patterns, trend, and risk management. Explore the full range of CappThesis services here:
Love the Warsh FOMC focus. KW will keep this short and sweet. I feel that the long end of the curve, 10Yr, will be calmed as it has been given his historical stance on the balance sheet but the 2Yr (most sensitive to Fed rate changes) will, as it has been, under pressure that will continue the 10y-2y spread flattening that we've witnessed since Feb '26 which has flattened from 72bps to now 37bps. What are the implications? Longer duration outperforms, Bank NIM compress - not the IBs that are making great fees on the IPOs.
Extremely well said, Kevin. Ty.