


Good morning. Here’s a blurb from the market section of today’s Opening Look.
For new subscribers, Opening Look is our daily pre-market note, in which we dissect the S&P 500, major indices, asset classes, ETFs and individual stocks. It’s categorized into four sections: Market, Statistics, Key ETFs and Chart Trades
Statistics – The first section analyzes daily market data such as new highs/lows, sector leaders & laggards, winning and losing streaks, how the market closes every day, S&P 500 vs. key moving averages and breadth. Seeing each one of these data points on the same table across multiple weeks reveals trends, sometimes before a shift is evident in the charts.
Market – The report’s second part is the meat of our market analysis. It includes studies, various S&P 500 charts, sentiment, breadth, indicators and a pattern tracker – a very helpful tool in determining our market stance.
Key ETFs – We showcase a handful of actionable charts from our 175 ETF universe in this section - potential breakouts/breakdowns, ETFs near important support/resistance zones and various other noteworthy set ups.
Chart Trades - Here we provide trade ideas based on individual stock charts. We categorize each idea so clients can easily understand the strategy. We also relay specific entry and exit levels, which presents a clear framework.
Chart Trades Live tracks all trading ideas in real-time.
Two fresh trade ideas were shared pre-market this morning. One stock is breaking out to new highs; the other is a mean-version trade in a stock from a key group that’s on the move again.
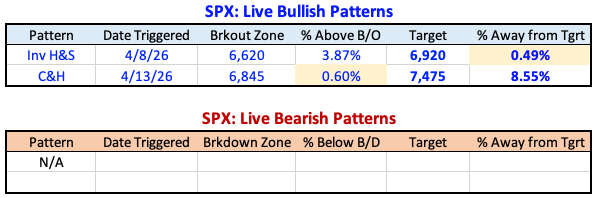
Two Live Bullish Patterns
With the market rallying in the face of apparent bad news over the weekend, the SPX moved closer to its 6,920-target – closing within 50 basis points of that level on Monday. More importantly, however, is what this price action did to the larger potential pattern we’ve been tracking…
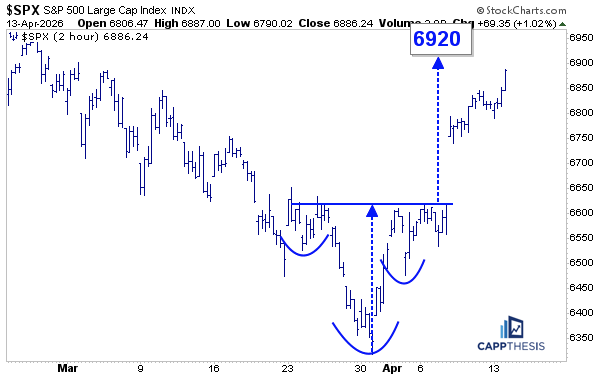
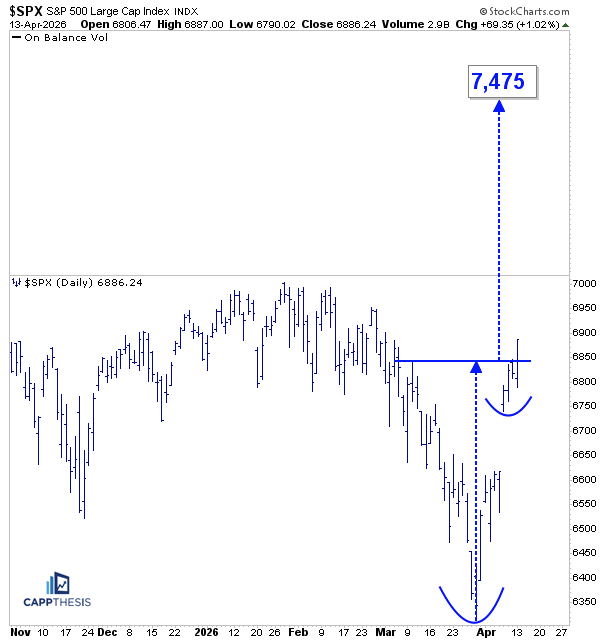
SPX 7,475
This is by no means a perfect formation, but the structure is clear enough to categorize it as a bullish cup-and-handle breakout. Given the advance from the lows, it produces a measured move target of 7,475 for the SPX. That implies roughly 8.5% upside from current levels.
As is always the case with measured-move targets, the breakout target percentage is less than the percentage gain that created the pattern. The reason is simple: the denominator is larger, so the resulting percentage move is smaller.
Regardless, like every breakout, this one remains tentative, and we need continued upside follow-through for it to maintain credibility. The SPX closed yesterday roughly 60 basis points above the breakout area.
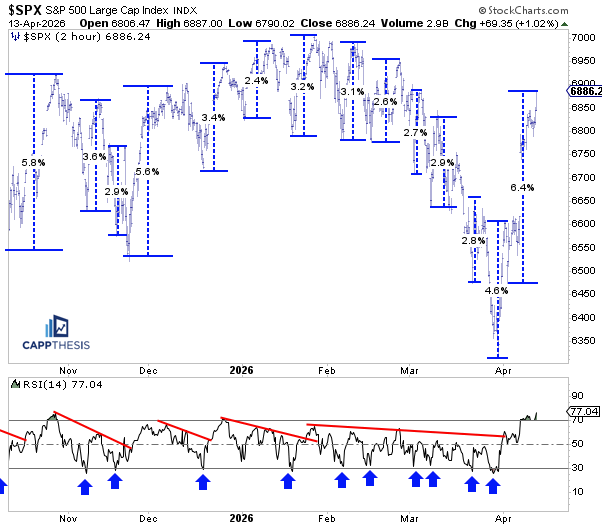
Short-term – Overbought persists
With the SPX now up eight of the last nine days and having recovered from Friday’s modest loss, the short-term RSI has remained in overbought territory for the past three sessions—an extended stretch by this indicator’s standards.
At any point, it would not be surprising to see some slowdown or a stronger effort by sellers to take profits. As noted above regarding the smaller of the two bullish patterns, this rally has created a meaningful cushion if/when that were to occur.
As we’ll recall, even during last year’s sustained comeback, there were several pullbacks that drove the 14-period RSI back to oversold territory along the way.
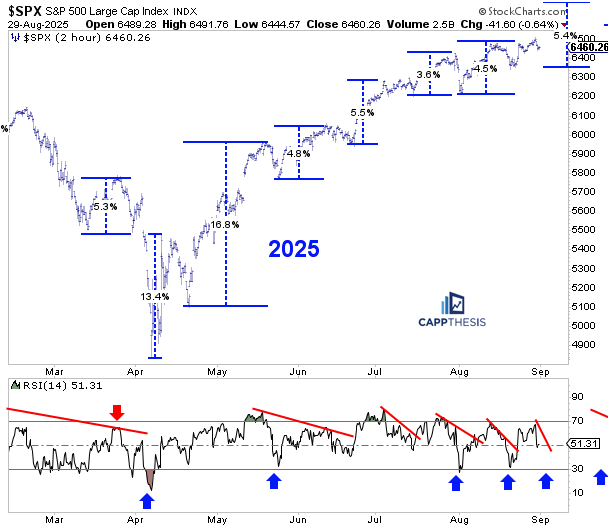
Short-term – The 2025 Bottom
For some perspective, here is how things played out on the two-hour timeframe in 2025. Clearly, the moves were much more severe in the early stages, while the pullbacks became notably tamer after the key April higher low.
We can also see how long the overbought condition persisted during the second half of May. The eventual pullback pushed the RSI close to oversold territory, which only encouraged another round of dip buying.
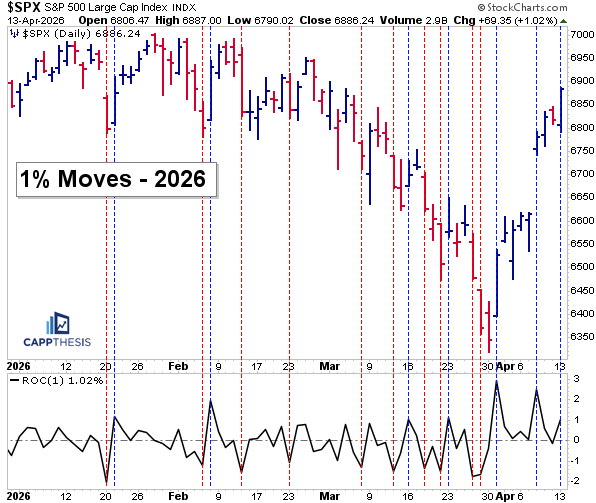
1% gains have returned
One of the obvious missing links through the end of March was the lack of 1% advances. Over the last two weeks, however, we’ve now seen three 1% gains and zero 1% losses, with the last 1% down day occurring on March 27.
We’ve seen this type of action before following key trading lows, when clusters of large upside days emerge after a sharp downturn. If this continues to follow that blueprint, the eventual path would be for the SPX to return to new highs, break through, and then transition into a period of lower volatility, uptrending price action.
As we know, that type of environment is highly supportive of bullish pattern breakouts.
Sentiment Check
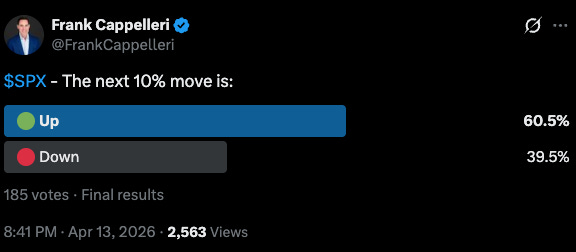
After a big move in either direction, it is always useful to check the crowd’s pulse. Some of the popular sentiment surveys and indexes are reported with a lag, so by the time we see those results, they are often less helpful. That is why I occasionally poll X, which I did last evening.
With 61% believing the next 10% move will be higher, that is a fairly clear sentiment signal—especially considering it implies that a majority of respondents can envision the SPX moving above the 7,475 target referenced earlier.
So, does that mean that a sizable follow through advance will not happen now?
Not necessarily. At this stage of the comeback, the price action is suggesting that the market is dismissing the worst-case scenario, namely that the situation in Iran will not materially worsen despite negotiations falling short over the weekend.
CappNotes offers a small window into the work we do at CappThesis - a technical analysis newsletter company focused on classical chart patterns, trend, and risk management. Explore the full range of CappThesis services here: