


The Setup for a Big Day
An excerpt from today's Opening Look

Key Points
The S&P 500 comes into Jackson Hole speech day with a five-day losing streak — the first such slide since December 26 through January 2. The last longer streak was six days, which occurred back in April 2024 (specifically April 12–19). That marked the end of a 6% drawdown from the March highs.
Today, we’re focusing on that losing streak as well as the five-day rate of change among other important S&P 500 charts. We’ll also take a deep dive into the U.S. dollar, 10-year yield, crypto, and other key topics.
Last Five Trading Days
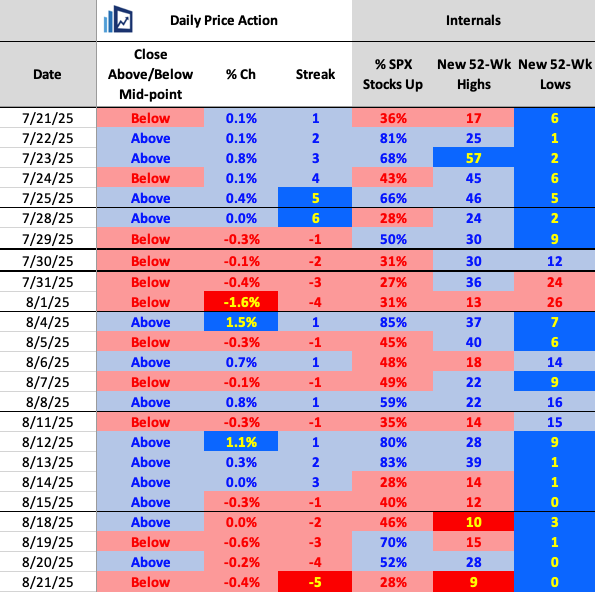
Daily Price Action
As just discussed above, the S&P 500 has now logged five straight declines through yesterday. Even though the prior two sessions showed positive breadth, yesterday did not — with only 28% of stocks advancing.
That 28% reading was the lowest since August 14. In fact, the number of 52-week highs — just 9 — was the smallest since May 29, a date that marked a key low before the market rallied strongly over the following two weeks.
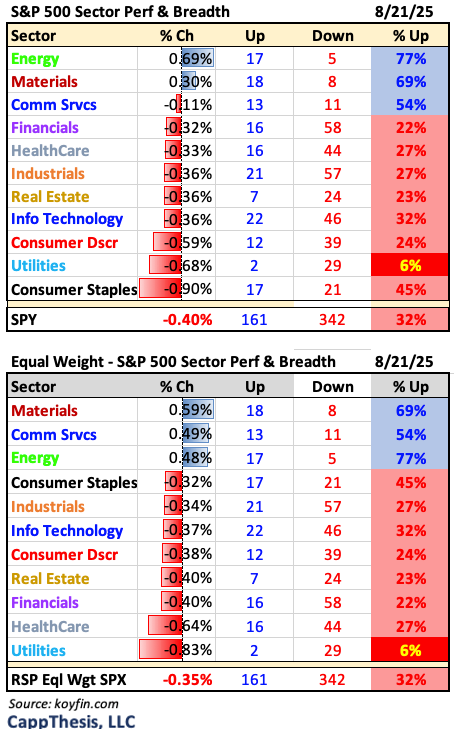
Sectors
Yesterday, only three of the S&P 500’s 11 sectors showed positive breadth — Energy, Materials, and Communication Services. None of the sectors gained or lost more than 1%, another example of the pause ahead of today’s highly anticipated events.
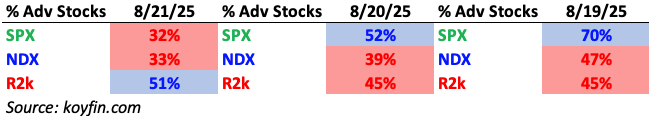
Breadth
Both the S&P 500 and NDX saw only about 3% of their stocks advance yesterday. Small caps fared noticeably better, with the Russell 2000 managing a marginal showing as 51% of its stocks finished higher on the day.
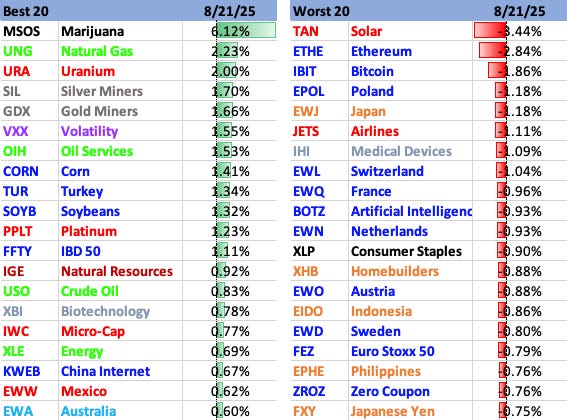
Best & Worst 20 ETFs
Cannabis once again led yesterday. We’ll take a closer look at its current bullish pattern, which the ETF is close to breaking out of again. There was a minor bounce back in select Energy areas, as well.
On the downside, Solar was hit hard, along with Crypto, Europe, Airlines, and Homebuilders.
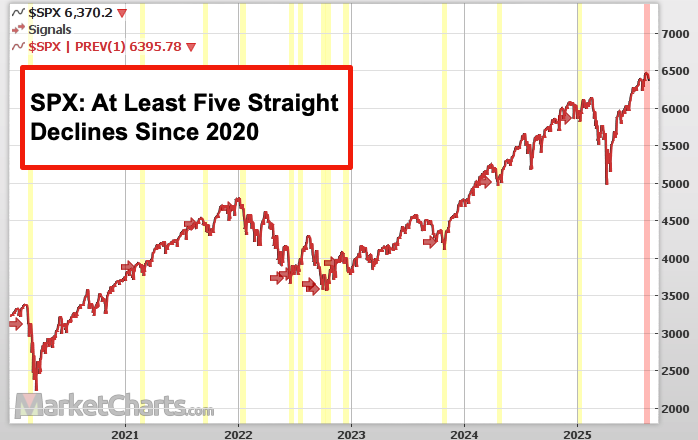
Five Straight Losses
Here’s a chart showing all of the losing streaks of at least five days going back to the start of 2020 (via MarketCharts.com).
The takeaway is that we’ve seen five-day losing streaks occur in various trading environments over the last 5½ years:
-During uptrends, as in 2021, 2023, and 2024.
-In bear markets, notably in 2022
-At key tops, such as early 2022 and late 2020.
– At key lows – again in 2022.
With the S&P 500 still battling its most recent high — and still up more than 30% from its low point — this current five-day losing streak could easily develop into something more severe on the downside. As always, it comes down to the potential follow-through.
Looking more closely at the data noted here, there were 12 prior non-overlapping instances of five-day losing streaks since 2020. Over the subsequent 10 trading days, the S&P 500 was higher six times and lower six times — clearly no directional bias.
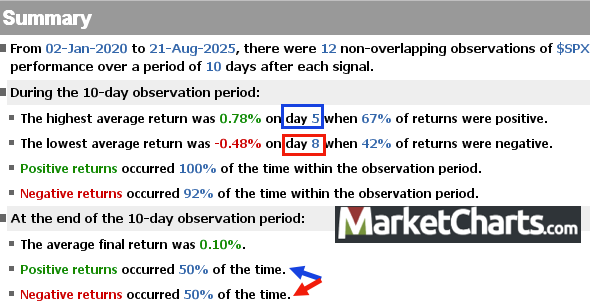
Of note:
The highest average return occurred on Day 5, with the S&P up about 0.80% and showing a 67%-win rate.
The lowest average return came a few days later, on Day 8.
What this tells us is that we typically see a bounce in the days immediately after the losing streak ends, but that bounce often fails to hold over the next five days.
Compared the broader patterns we focus on, this is secondary, but still useful context to keep in mind.
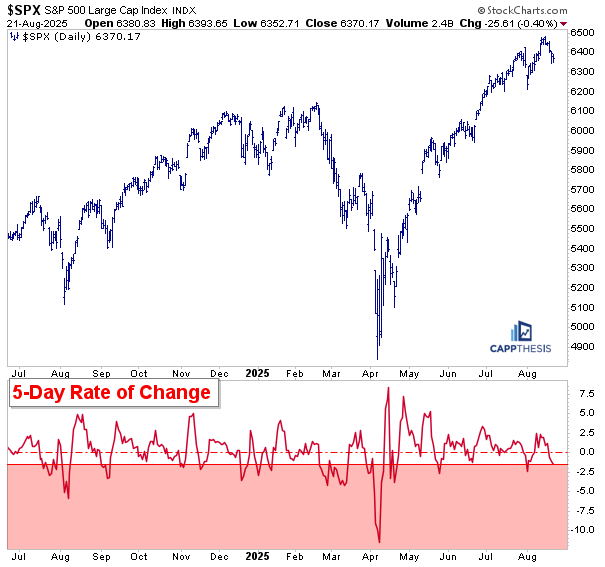
Five Day Moves
Even though the S&P 500 is logging one of its longest losing streaks in recent years, the five-day rate of change at only -1.5% is nowhere near the extremes seen in prior episodes (as shown in the chart’s bottom panel). The interpretation really depends on one’s personal bias.
From a bullish perspective, this modest pullback shows that the bears have yet to get aggressive, as they’ve been unable to push the S&P meaningfully below its recent high. In that sense, the pullback looks no different than prior ones since the April low.
From a bearish perspective, this could be the early stage of a bigger rollover, with buyers — who had previously stepped in during this advance — now showing reluctance, which in turn has fueled the current losing streak.
Ultimately, this chart is more about setting the backdrop than making a prediction. If the bears still can’t inflict real damage after a five-day slide near the highs, it suggests the buyers remain in control for longer.
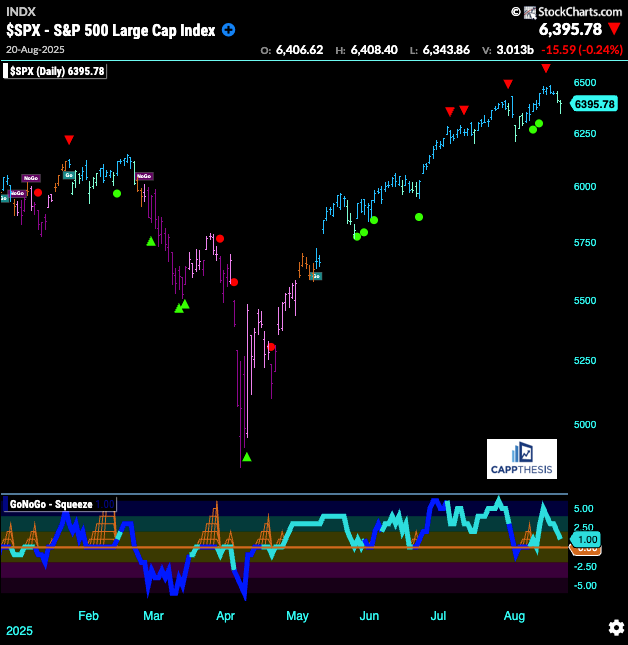
GoNoGo Trend – Daily
The GoNoGo Indicator remains bullish, as shown by the green bars (bullish, but not extreme) holding for two straight sessions. That’s the longest streak of green bars since late May, when we saw three in a row — shortly before the market turned higher. This highlights just how strong and aggressive buyers have been throughout the advance.
It will likely take more time and weakness for the indicator to flip back to bearish, but our focus here is on detecting even the smallest changes in trend, which the GoNoGo framework is designed to capture.
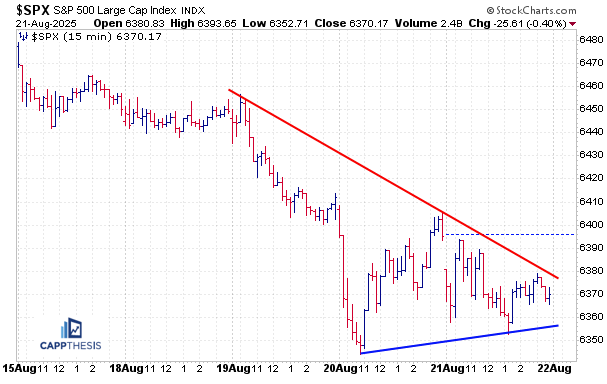
Live Patterns
The S&P 500 starts the trading day…