


Good morning. Below is a selection of highlights from the past two days of premium notes.
Also, check out my CNBC appearance from yesterday on Morning Call. As Morgan says, it was a lightening round, indeed.
Daily Price Action
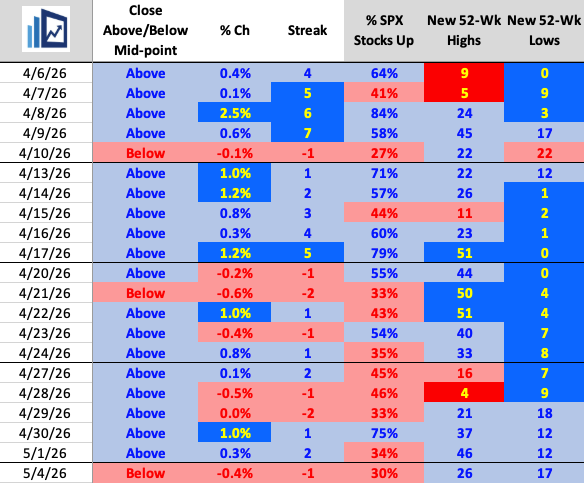
It may not feel like it, but the SPX now has endured six declines in the last 11 trading days. Over that stretch, the index is still up 1.2%. We know why — the declines have been very small. The last loss greater than 60 bps was on 3/27, which also marks the last 1% decline (-1.7%). The biggest concern continues to be the sub-par breadth: we’ve now seen eight negative breadth days in the last 10 sessions.
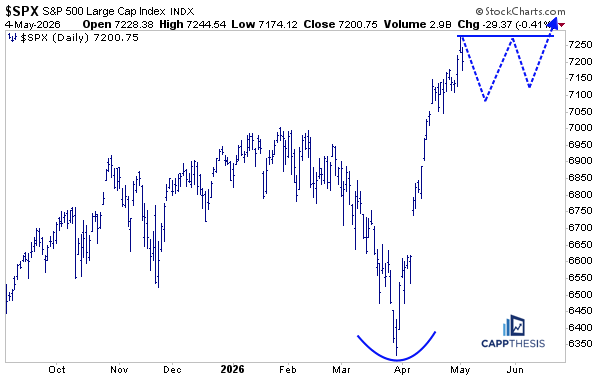
Two live bullish patterns
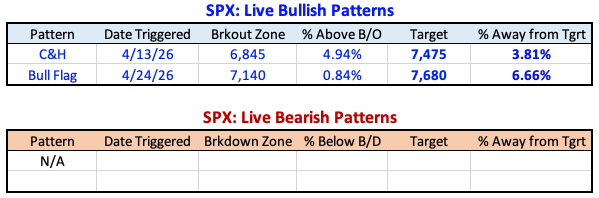
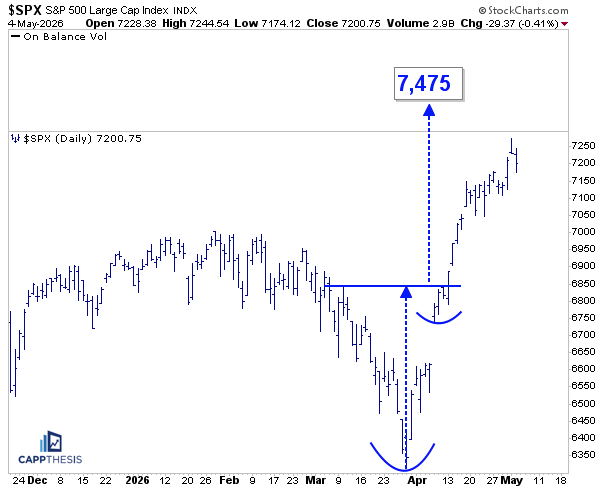
SPX 7,475
The 7,475 target remains in play.
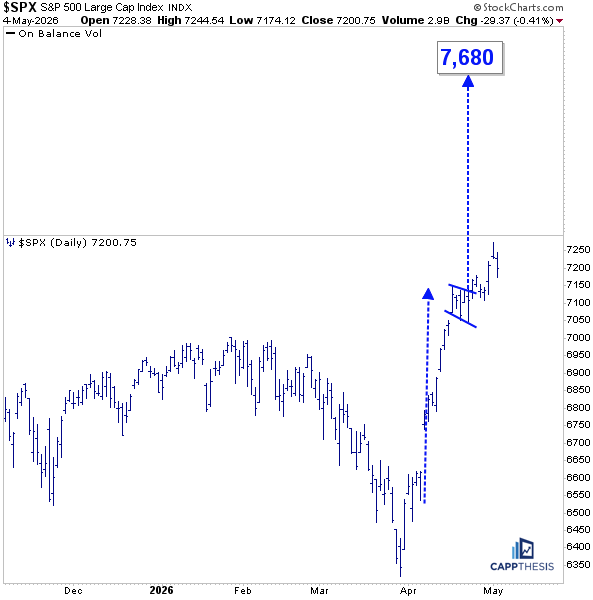
The Bullish Flag Pattern Breakout
7,680 also remains alive for another day.
The Potential cup and handle formation
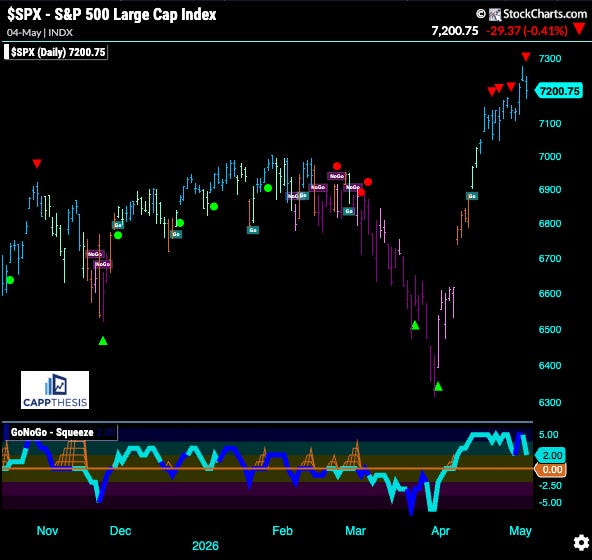
GoNoGo – Remains in Go Mode
The fourth countertrend, short-term sell exhaustion signal hit the GoNoGo chart after yesterday. Given that the index has seen more declines than gains over the last two weeks of trading, this isn’t surprising. So far, the SPX is digesting the recent spike constructively.
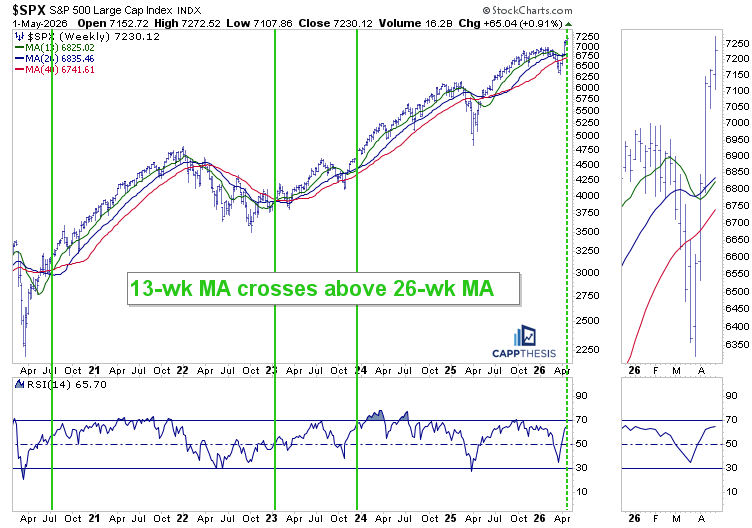
When the 13-wk MA crosses above the 26-wk MA
So, after such a strong comeback—and an extremely powerful April, up 10%—what more could we realistically ask of the SPX at this point?
From a weekly perspective, here’s the SPX with the three key moving averages we track: the 13-week (green), the 26-week (blue), and the 40-week (red). As expected, all three have started to curl higher, albeit with a lag.
Thus, the next step in bringing the intermediate trends in line with price would be for the 13-week moving average to cross back above the 26-week moving average. As we’ve seen over the past several years, when that crossover occurred, it led to further upside in the weeks and months that followed. Upside We’re not quite there yet—but we may not be far off…
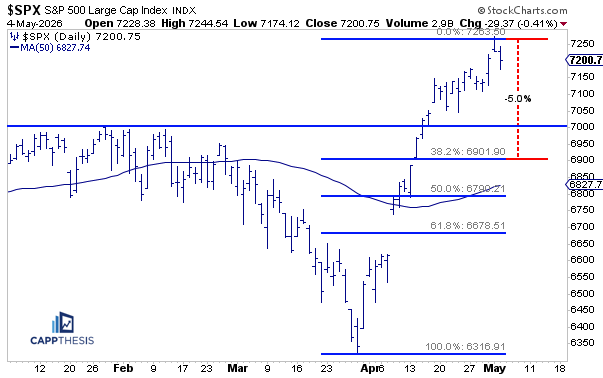
Drawdown Scenarios
Again, with the market being so strong for so long, we’ve naturally focused on bullish patterns, upside targets, and supportive momentum. Those are all positive factors and a reflection of the historic rebound from the lows. At some point, though, we have to consider what a drawdown could look like—and ideally, a constructive one…
So… from last week’s highs, a 5% pullback would take the SPX down to about 6,900. That would line up with a prior congestion zone from earlier this year, as well as the 38.2% retracement level (measuring the March-May rally). Below that is the 50-day moving average, currently closer to 6,820. However, it’s rising quickly—about 6 to 8 points per day. Over time, that average would also approach the 6,900 area.
This doesn’t have to be exact, but the point is this: a pullback to anywhere near this zone would present a spot where patient buyers may look to step in, while also keeping the bullish patterns from recent weeks intact.
Rotation Watch
While we wait for many more growth companies to report over the next two weeks, many companies with Industrials and Financials have released earnings. That reduces company-specific risk in those groups and could mean less volatility for XLI and XLF. We’ll see.
Regardless, if there is any short-term rotation out of Technology, both sectors could be candidates for capital to rotate back into, and each is showing a constructive setup.
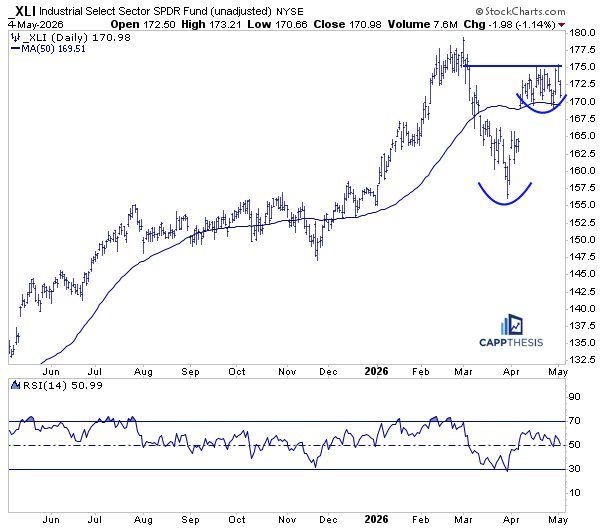
XLI Industrials
The ETF saw a strong bounce from late March into early April, but has done very little over the past few weeks. That’s not a negative. It’s been consolidating above its 50-day moving average, and in the process may be forming the handle of a bullish cup-and-handle pattern.
At the same time, the 14-day RSI has held just above the 50 level. Seeing RSI stay in that 50-to-overbought range is a best-case scenario, and it mirrors the behavior we saw during much of last spring-to-summer’s advance.
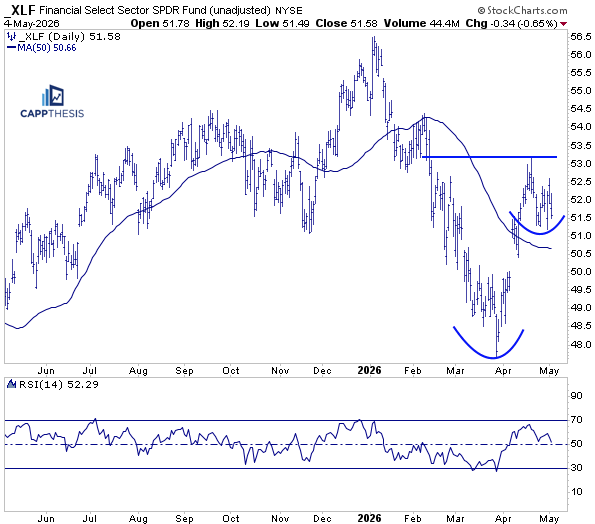
XLF Financials – Another potential cup and handle pattern
XLF Financials, as we know, began to lose ground as 2025 ended and 2026 began, right as many of its largest components were reporting earnings. It dropped hard and has since rallied strongly off the lows. Like XLI, has spent the last few weeks in back-and-forth consolidation.
The formation isn’t as technically sound (at least not) as XLI’s, but it is notable that XLF is attempting to hold a higher low above its 50-day moving average. If it can push back toward—and reclaim—the area near 53 from two weeks ago, it could complete a bullish cup-and-handle-type structure from this perspective.
These are two major non-growth sectors, both consolidating after strong rebounds. If the market is going to continue higher, rotation will likely be a key theme.
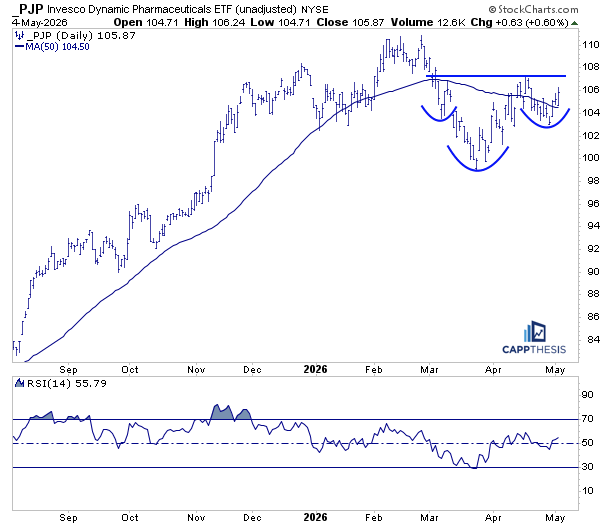
PJP Drugs – A familiar pattern
Beyond XLF and XLI, another area showing a similar structure is the PJP pharmaceutical ETF.
It has also done a good job rebounding from its March lows but peaked in mid-April and has spent the last two weeks trying to recover. As the chart shows, with a bit more follow-through, it could return to the 107 area. A move above that level would confirm a two-month inverse head & shoulders pattern.
CappNotes offers a small window into the work we do at CappThesis - a technical analysis newsletter company focused on classical chart patterns, trend, and risk management. Explore the full range of CappThesis services here: