


SPX vs. Cumulative Adv-Dec Line
Let’s discuss market breadth. As we review every day in the Opening Look piece and every week and month in the comprehensive Roadmap reports, the SPX’s cumulative adv-dec line has been making new highs since May 2nd. Here’s the monthly chart. We dissected and how why the line has come back so strongly a few weeks ago in the 5/8 report entitled “Mirror Image.”
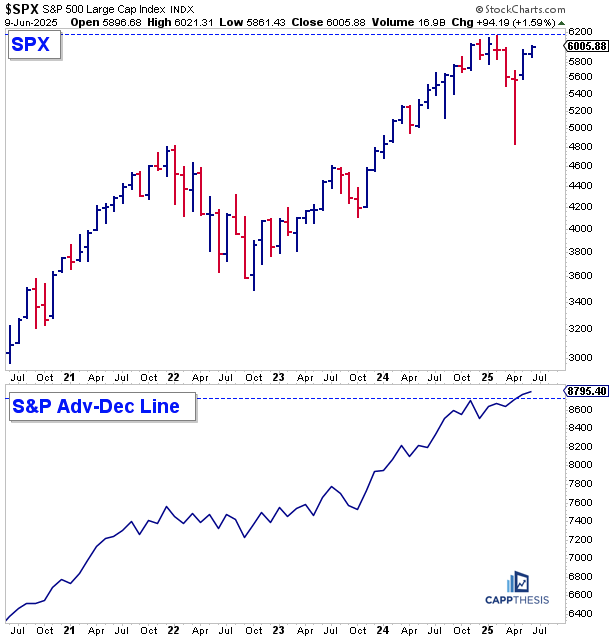
So, what’s the likelihood that the SPX continues to play catch up and eventually make new highs soon, itself? Well, the recipe has for that to happen has been playing out as well as we could have hoped for the last few weeks: seeing a multitude of bullish breakouts nearly everywhere we look, combined with hardly a trace of two-way volatility. Those two factors dominated the market from October 23 through December’24, literally creating the uptrend.
Along the way, we did have to deal with a few profit-taking events, which we’ll undoubtedly have to contend with again now – whether those end up being ultimately harmless respites or more severe.
As we talked about last week, various indicators suggest a short-term stretched condition – especially all of the Demark work, which is getting more and attention given the plethora of Sell 13s out there now. Again, those work great in highly volatile markets – trading ranges or bear markets. In uptrends, they do tend to signal slowdowns, but those slowdowns don’t mark major tops. We’ll get a true sense how those signals are dealt with this time very soon.
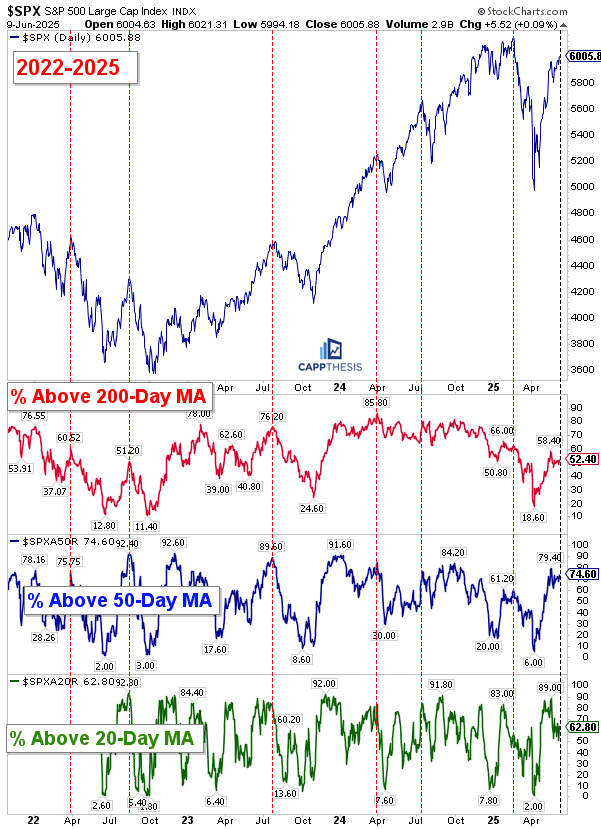
% of SPX Stocks > 20, 50 and 200-DMAs
One other breadth gauge we’ll be watching during that next inevitable drawdown is the % of SPX stocks trading above the key moving averages. Needless to say, each of these lines has snapped back from extreme low points the last few weeks.
The % above 20 and 50-Day lines have nearly gotten back to extreme high points from the last few years. Notice that the % above the 20-DMAs already has come off that high. While that’s a negative divergence, it’s not a major one. Invariably, the shortest moving averages will catch up first after a big market bounce. Many stocks have consolidated the last two weeks, with some now having slipped below their 20-DMAs. Another leg higher would soon put those stocks back above their respective 20-day lines.
Longer-term the one to watch is obviously the % above the 200-DMA. That got as high as 58% and is now at 52%. It’s a lagging indicator, but we see how it hovered above the 70% level from late 2023 through late 2024. Thus, for the SPX to truly replicate that period, we’ll eventually need to see more stocks reclaim their long-term lines and stay above them…
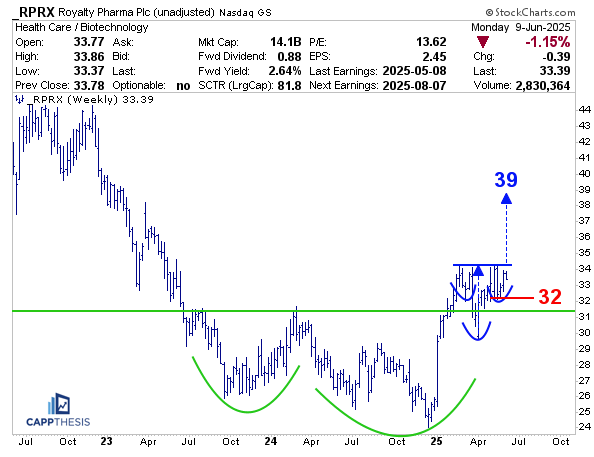
RPRX Royalty Pharma
A strict trading screen we run spit out six stocks from a universe of 10,000. RPRX was one of the six. We’re profiling it for three main reasons, all of which should be obvious.
1-It’s close to completing a multi-week bullish inverse H&S pattern. If it can, the upside target would be at 39.
2-That formation has taken shape above the breakout zone of a much bigger base.
3-Zooming way out, it’s clear that RPRX has potentially a lot more ground to make up. Its high was 56.50 in 2020, a few days after its IPO.
Any thoughts on XLU and where rates may be headed?