

Two Simple Trend Gauges
And powerful... if used correctly

We often talk about these two technical indicators, but we shouldn’t discount their importance just because they seem simple.
👉 We’re referring to the 20-day moving average and the 14-day RSI.
Again, this is nothing new, but when we’re in the middle of a steady, non-volatile uptrend that has persisted for months, keeping these tools at the forefront helps maintain perspective.
For example, the S&P 500 did not undercut its 20-day moving average for many weeks — from mid-April through the end of July – which was among the longest runs on record. When the index did finally close below that short-term trend indicator on August 1, there was chatter about it being a potential sell signal.
Of course, that did NOT play out, as buying demand quickly resurfaced and the index pushed higher again…
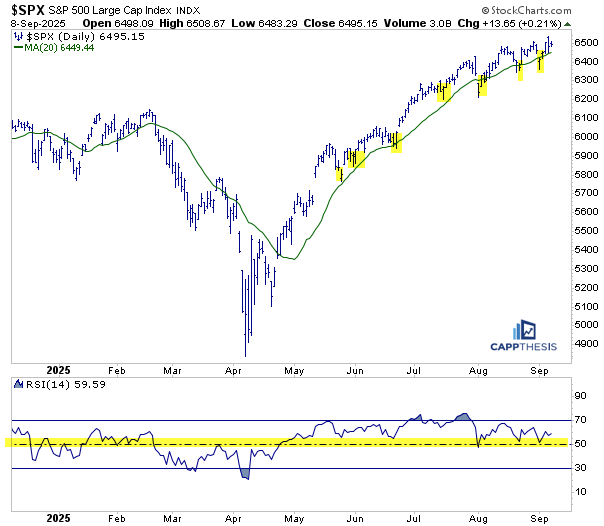
Since then, the index has revisited the 20-day moving average multiple times, and each time demand has returned, allowing the S&P to notch marginal new highs.
At the same time, the 14-day RSI has oscillated between the midpoint (~50) and overbought territory. Along the way, we’ve seen several negative divergences — the S&P making new highs while RSI formed lower highs.
As we know, negative momentum divergences are worth monitoring but shouldn’t be used as the sole reason to change a market stance. Intermittent divergences are natural in an extended uptrend.
The real key is not whether RSI becomes overbought every time the S&P makes a new high, but whether it respects the midpoint of its range during pullbacks. And so far, that has clearly been the case.
2023-24
This is the type of behavior we’ve seen many times before. One period we continue to reference is late 2023 through early 2024, when a very similar scenario played out.
The initial lift through the 20-day moving average in November kept the index above that line into the start of 2024. Even when the 20-day was undercut for the first time, it did not mark the end of the rally back then either. In fact, the advance continued through the end of March, even as the index came close to — or briefly dipped under — the 20-day multiple times.
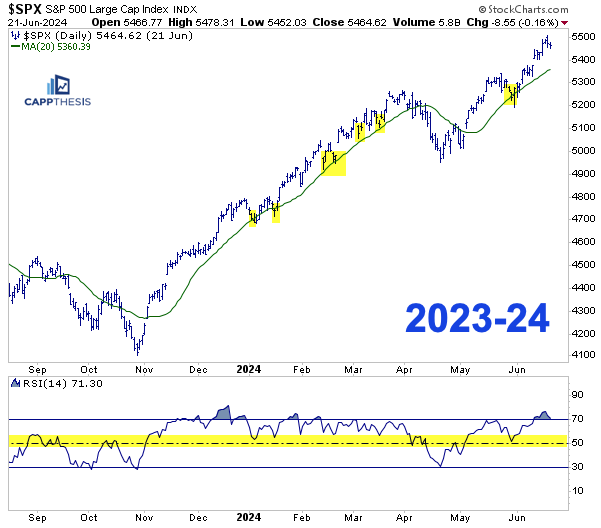
That changed in late March, when the S&P slipped through the 20-day at the same time the RSI dropped noticeably below the 50 level. This ultimately led to about a 6% pullback — not overly damaging, but still larger than anything seen in the prior few months.
From there, when the S&P rallied to a higher low in May and reclaimed the 20-day, it sparked another few months of trending action.
⁉️ So how does this help us now?
We know that at some point the 20-day moving average will be undercut again. And if we do NOT see buyers step in quickly afterward, resulting in a lower high, that could tell us the character of the trend is changing.
If that happens, we’ll likely see it reflected in the RSI struggling to hold above its midpoint, rather than bouncing as it has in recent months.
Until then, let’s not force the issue and prematurely anticipate a trend change before more evidence comes to light.
📆 Every Monday, we write an expanded Opening Look piece and discuss many more key ETFs and asset classes.
Here’s one of them from yesterday’s piece on the XBI Biotech ETF.
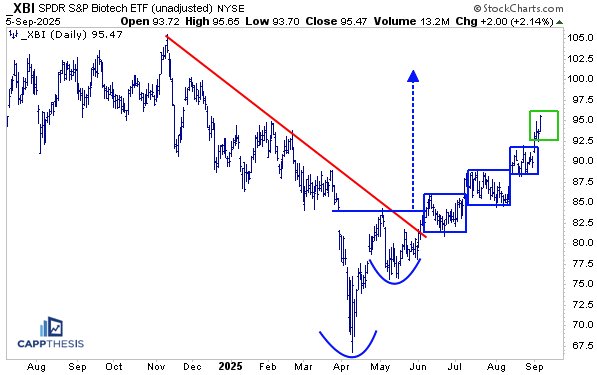
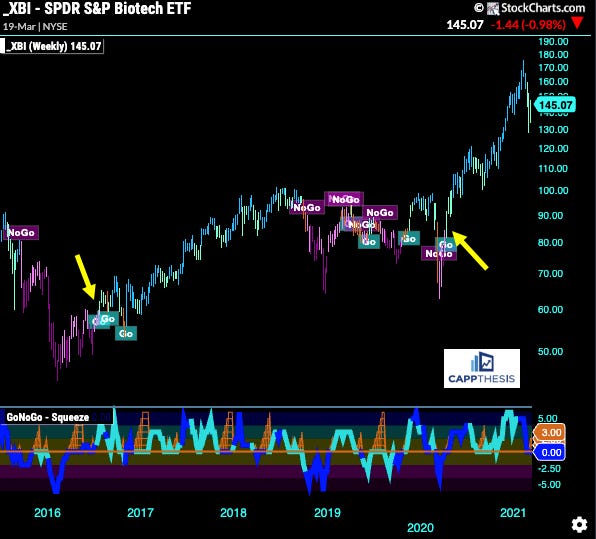
XBI Biotech
XBI had a strong week, capped by a solid showing on Friday. The ETF continues to extend from its cup-and-handle breakout in May and has now logged three straight Trading Box breakouts along the way. A fourth Trading Box is currently under construction, suggesting momentum remains firmly intact…
Last week’s move flipped the weekly GoNoGo trend from neutral to bullish, which is obviously a step in the right direction. That said, we can see that this indicator has produced false signals before—most notably in 2023 (highlighted by the yellow arrows)—so it’s something we can’t fully rely upon…
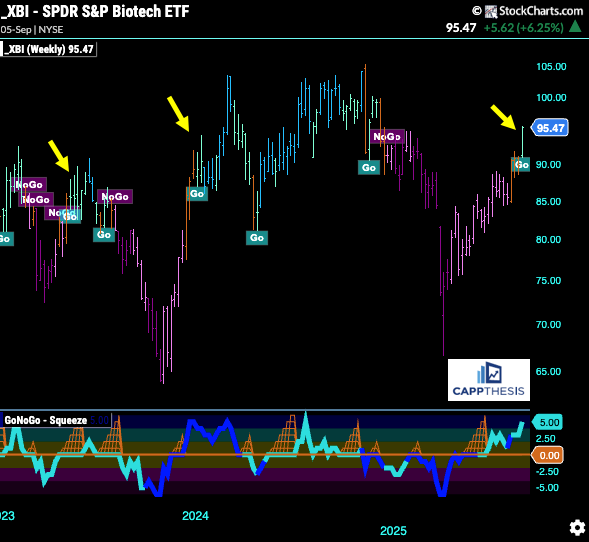
However, we shouldn’t ignore this signal. Looking back, there are at least two notable instances when a weekly GoNoGo trend flip to bullish led to multiple years of strong upside—most recently in 2020 and before that in 2016.
We’ll continue to use the pattern work as a guide, but it’s worth keeping a close eye on this chart as well.
Excellent analysis!
Love these simple trend recognitions, thanks for posting.
Just to confirm though, should there a "not" in this sentence? ie. not force the issue?
"Until then, let’s force the issue and prematurely anticipate a trend change before more evidence comes to light."