

Two Straight 1% Gains
Plus a note on Gold Miners

Happy Tuesday - Here’s an excerpt from today’s Opening Look piece. Among other topics, we discussed the S&P 500 and Gold Miners, both of which are shared below.
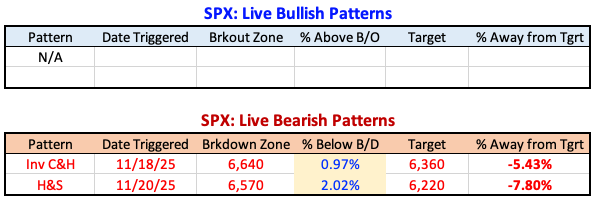
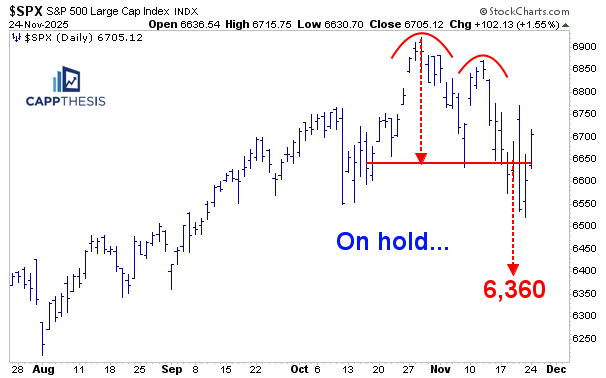
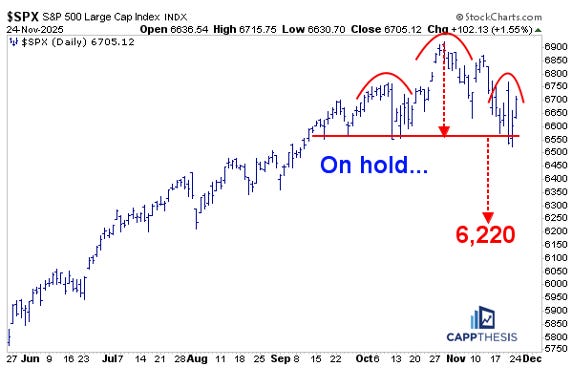
The SPX’s strong two-day snapback on Friday and Monday has put both of the bearish patterns we’ve been tracking at risk of being negated. As shown on the above pattern grid, the S&P has now closed back above both prospective breakdown zones.
This technically allows us to classify these patterns as “negated.” However, given the fierce volatility over the last few weeks, we’re keeping them on the grid for now. As the charts indicate, we’re marking the bearish patterns as “on hold.”
We’ll be watching the coming sessions carefully. If the index can continue to rally or simply hold above those breakdown zones, we’ll consider the patterns officially nullified and remove them from the table.
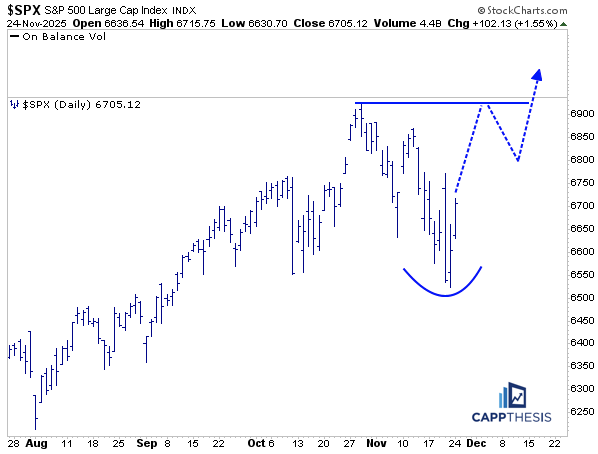
Potential Patterns
From a bullish perspective, the potential bottoming formation remains valid. The next step is to see continued follow-through, which would help clarify what this setup may ultimately evolve into.
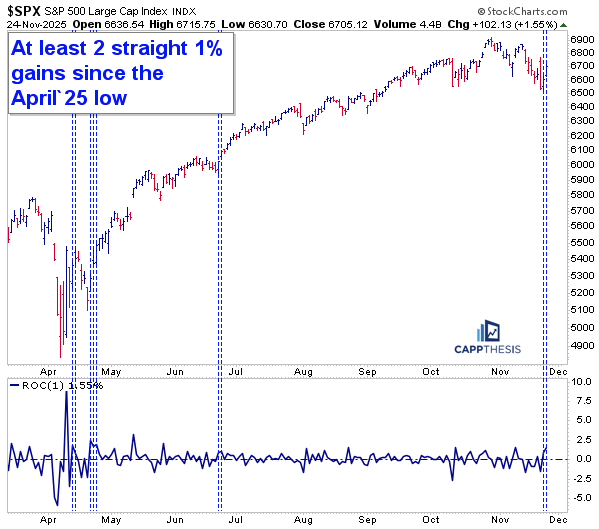
Two Straight 1% Gains
The S&P has now posted two straight 1% gains, something we haven’t seen since June 23–24. Those dates may not stand out, but the market had just undergone a mild pullback after the latest FOMC meeting the week before. It ended up being a small drawdown, which produced a four-day losing streak. Ultimately, it created a clear dip-buying opportunity
Before June, the two prior instances occurred in April, first from April 11–14, just three days after the crash low, and then again during the three straight 1% gains from April 22–24. This period represented the most important part of the entire comeback.
It occurred right after the key higher low on April 21 (a sharp 2.4% selloff that seemed very concerning at the time).
The three 1% gains that followed washed out shorts and subsequently catapulted the market into May, after which volatility collapsed and ushered in the nearly uninterrupted advance through October.
The question now is whether the index can once again leverage this two-day burst into something more meaningful. The SPX remains in a slight downward channel, but it wouldn’t take much to revisit the October highs.
And that would open the door for a potential late-Q4 chase, similar to years with strong uptrends that finished strong: such as 2023, 2021, 2020, and 2019, with 2024 also fitting the pattern — albeit with a choppier finish.
Short-term
The rally from Friday’s low is up about 2.9%, roughly the same magnitude as the prior rebound attempts during this pullback, both of which faded at 3.5% and 3.0%. The S&P still needs additional follow-through to differentiate this move.
The 14-period RSI on the two-hour chart begins the day in the mid-50s. We haven’t seen overbought conditions since October, which aligned with the last all-time high. Returning to overbought territory, thus, will be extremely important to extend this comeback.
Another notable development: the latest pullback did not produce an oversold RSI reading, unlike the previous two. This difference could represent a positive divergence, helping attract buyers. This may be an early change of character, with the next important step being an overbought reading.

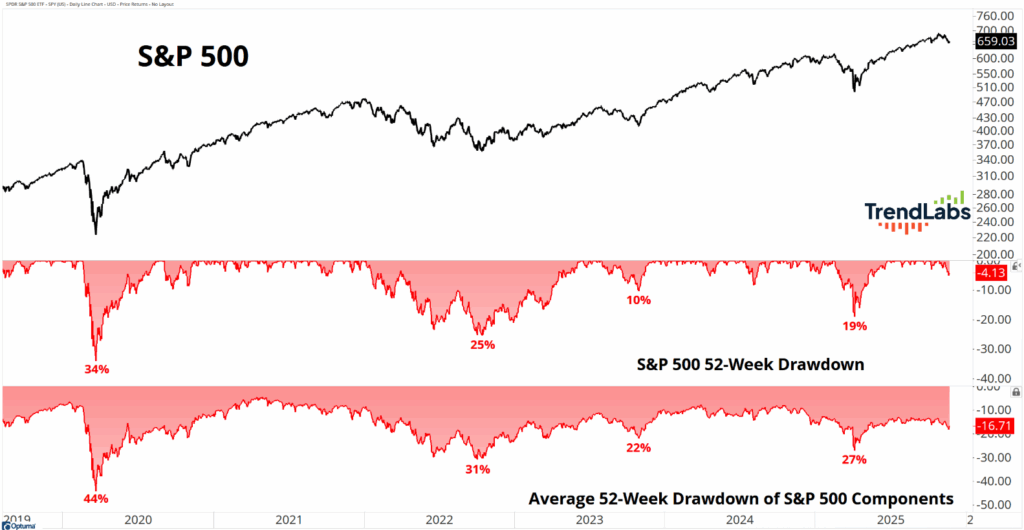
Drawdowns – SPX vs. Components
For weeks, the theme has been clear: the average stock has endured far more downside than the S&P 500 itself. Mega-caps continue to hold up better, and the index’s cap-weighted nature has kept headline performance resilient.
As of now, the S&P is only 4% below its high, while the average stock is still down roughly 16% — even after the rebound. The divergence is well illustrated by Sam Gatlin of Trendlabs on this chart below.
This raises the usual question: Who is leading whom?
Do mega-caps need to catch down, or are the more heavily sold-off sectors now downside exhausted, ready to bounce?
Friday offered early evidence of rotation into laggards, which produced the big 1.6% advance on nearly 90% breadth… with tech lagging. Indeed, the best-case scenario is broad participation — something that defined much of the rally in 2025. This will be a key theme to watch through December.
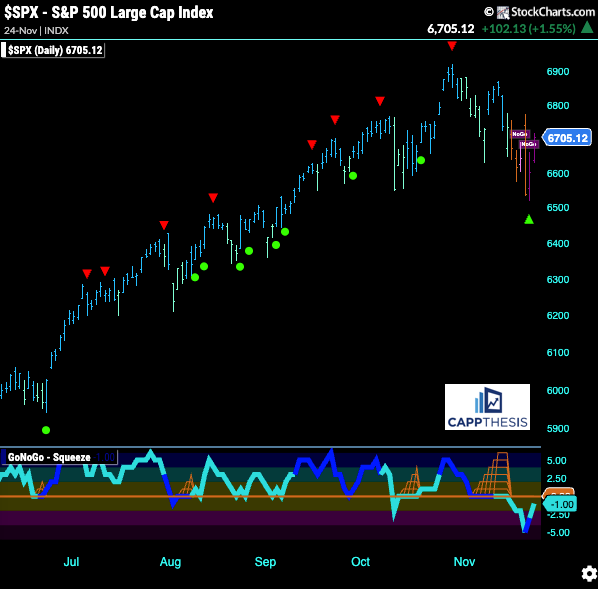
GoNoGo Trend – Daily
Yesterday’s strong showing still hasn’t flipped the GoNoGo Trend back to Go, but it did trigger the countertrend buy signal (green rectangle). We’re watching closely for a possible trend shift.
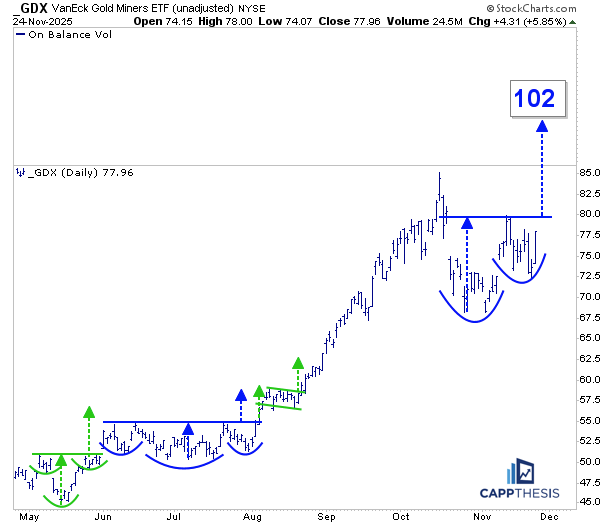
GDX Gold Miners
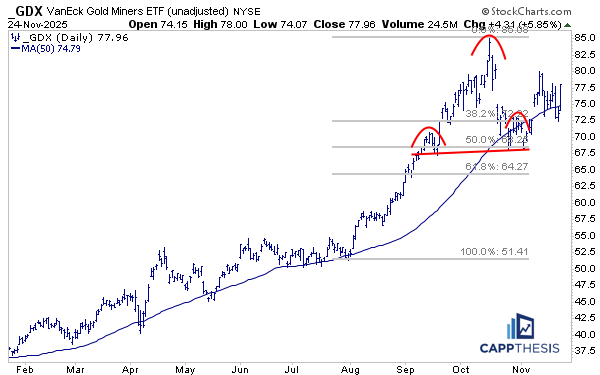
Gold Miners ripped nearly +6% yesterday, quickly revealing a potentially substantial bullish cup-and-handle formation.
After October’s pullback — which saw the “helium” come out of the precious-metals balloon — the ETF entered support-discovery mode.
The best-case scenario we talked about back has since unfolded:
Hold/establish support
Follow through
Form a higher low
Construct a bullish pattern
Break out (not yet)
Price has bounced back and forth to reach this point, but now the setup is clearer. A move through 80 would complete the pattern. If confirmed, the measured target is near 102 — meaningfully above prior highs.
This move follows a classic sequence: a blow-off top, a decline, finding support near the 50% retracement of the August–October rally, and then an extended tug-of-war around the 50-day moving average.
A potential bearish formation emerged during the churn, and as always, we must respect bearish setups during long-term uptrends unless proven otherwise.
But the downside break never occurred, and in typical fashion, a failed bearish pattern gave way to a strong move in the opposite direction — often the seed of a bullish formation, which now appears to be unfolding.
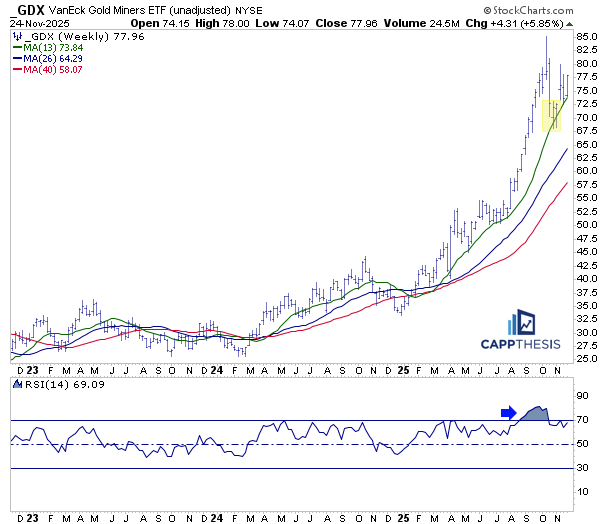
We also knew that the extremely overbought weekly RSI would eventually need to be neutralized. That process coincided with the ETF testing and holding above the 13-week moving average.
While we expected the RSI to pull back more deeply than the high-60s, the key point is that weekly indicator has remained in the upper half of the range ever since the early-2025 breakout — a constructive sign during strong uptrends.
Other than Crypto, $, USO, UNG, most of the indices confirmed the uptrend from late friday to yesterday itself with PM Sector emerging as High RS leader.
Checkout my UVCMI Trackers
https://open.substack.com/pub/uvc9876/p/frequent-up-datesdr-uvs-master-tracker_102925_we?r=58xvw2&utm_campaign=post&utm_medium=web&showWelcomeOnShare=false