


TGIF.
First, here’s a link to my CNBC appearance this past Wednesday.
The following is an excerpt from today’s Opening Look, where we spent some time weighing the various technical forces pulling the SPX in different directions. It turned out to be a revealing exercise, to say the least.
SPX – Positive vs. Negative
To better gauge the market’s direction, I lined up several bullish and bearish factors for the S&P 500 last evening. The goal was to see if one side clearly held the edge.
The result? Nearly every positive factor currently had a corresponding negative through last night’s close.
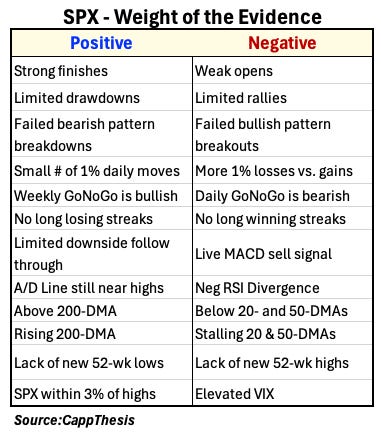
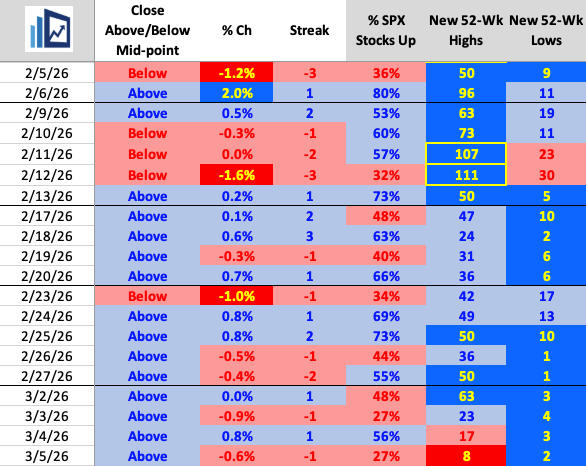
For example, the S&P 500 has closed above its intraday midpoint in 13 of the last 14 sessions, which typically reflects strong underlying demand. However, the index has not been able to string together more than two consecutive gains in nearly three weeks. In other words, strong finishes have rarely translated into follow-through the next day — one reason the market has essentially been running in place.
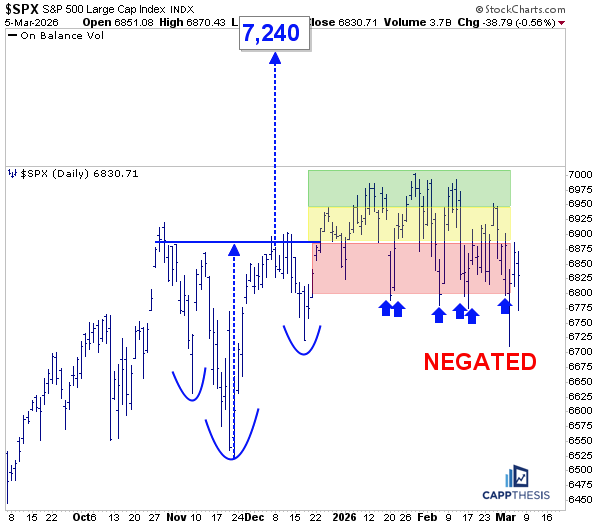
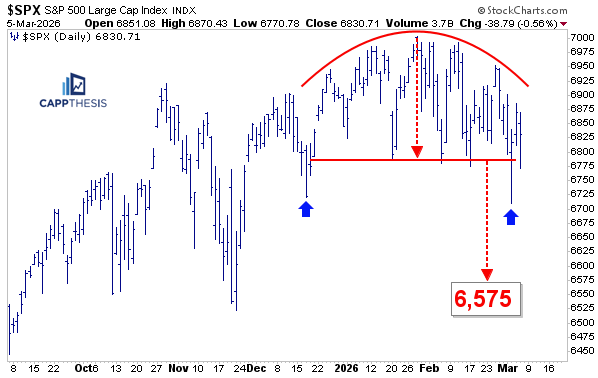
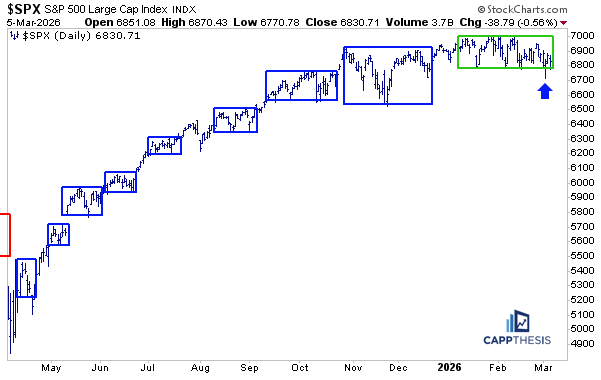
Meanwhile, the bullish pattern we had been tracking on the SPX eventually wore out its welcome and, as you know by now, it was negated earlier this week. The index simply failed to make meaningful upside progress before the pattern expired.
At the same time, no major bearish formation has fully triggered either, as buyers have stepped in during recent pullbacks. That could change today.
Another interesting contrast involves breadth versus momentum. The advance-decline line has come off it highs, but so far, we’ve yet to see a very extreme negative breadth session.
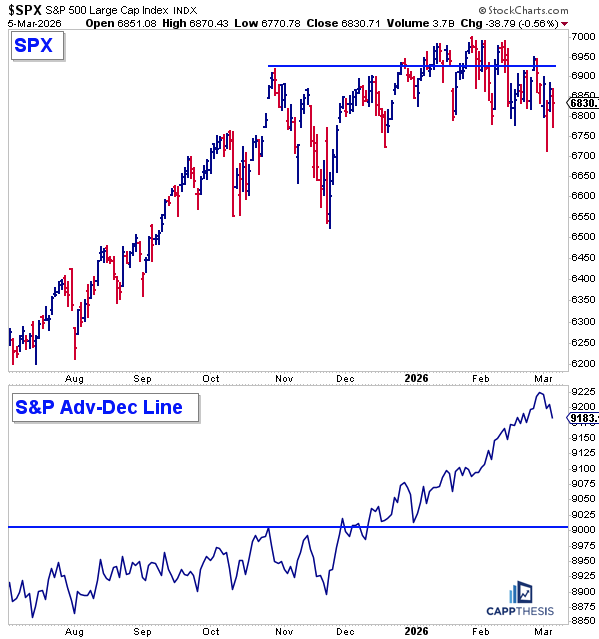
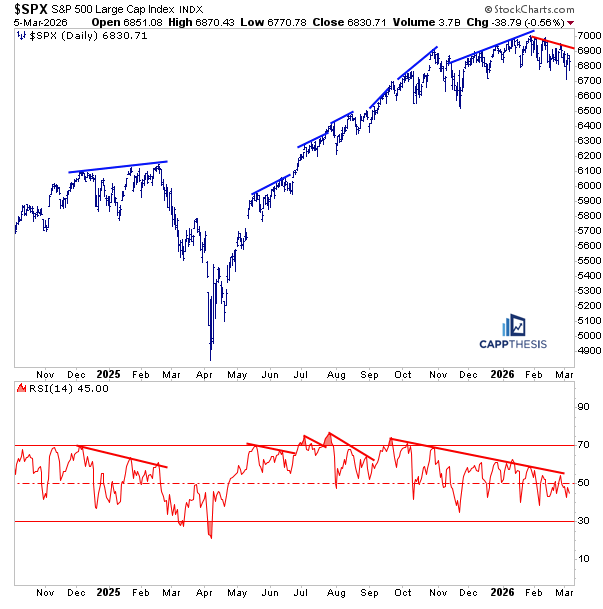
But momentum has been fading for quite some time. RSI has been showing a persistent negative divergence and has not reached overbought territory since last September — a clear sign of a slow momentum bleed.
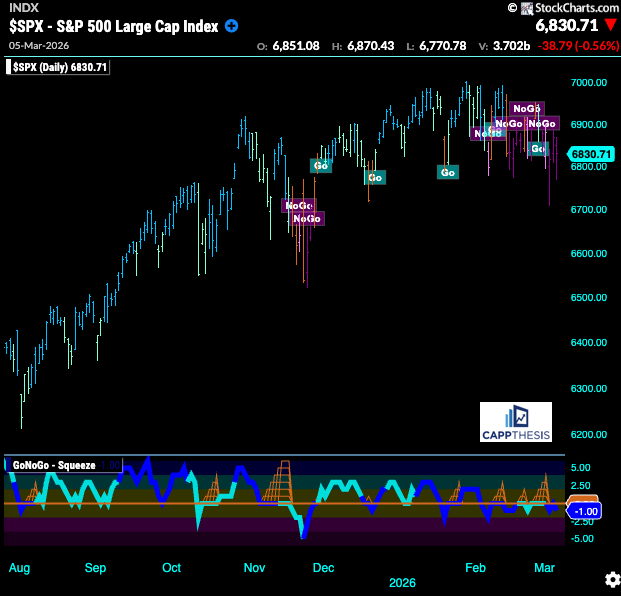
We’ve also seen momentum unwind via the GoNoGo indicator being in mainly NoGo (bearish) the last few weeks.
Participation trends tell a similar story. Not long ago, the index saw multiple sessions with more than 100 stocks making new highs, a sign of strong breadth. Yet historically those surges have sometimes marked short-term exhaustion, which appears to be playing out again now. Even so, new 52-week lows remain relatively muted.
Finally, volatility has surged even though price has not moved very far. The VIX has jumped roughly 110% from its late-December low to its recent high, yet the S&P 500 remains only about 3% below its highs. That’s an unusual divergence and a reminder that sharp moves in volatility don’t necessarily mean equities are collapsing.
Bottom Line
Despite all the crosscurrents currently affecting the market, opposing forces have largely kept the S&P 500 moving sideways.
Ultimately, it still comes down to how this trading box resolves.
Needless to say, if the negatives begin to outnumber the positives, which we can easily track on the simple table shared above, it clearly would suggest the tide is turning more decisively toward the bears… and vice versa.
Sentiment… according to Grok & X
I also asked Grok last evening whether the millions of X users it scans appear more bullish or bearish on the stock market. After parsing through a large amount of commentary and sentiment data, the overall tone came back cautious to bearish.
Several factors are contributing to that mood. Geopolitical tensions involving the U.S., Israel, and Iran have added uncertainty, while volatility has increased and oil prices have been moving higher. At the same time, parts of the technology complex have come under pressure. Application software stocks, for example, are down roughly 25% year-to-date, reinforcing the idea that some leadership groups are struggling.
Traditional sentiment gauges are reflecting a similar tone. The CNN Fear & Greed Index sits at 31, firmly in “fear” territory. Meanwhile, the latest AAII survey shows 35.5% bearish versus 33.1% bullish, with bullish sentiment still below its long-term average.
Commentary across X also leans cautious, with many traders referencing heightened volatility, geopolitical risks, layoffs, and weakness in other risk assets. Options positioning echoes this concern as well, with elevated put/call ratios suggesting investors are hedging downside risk.
Of course, there is also a contrarian view forming. Some market participants argue that widespread pessimism itself can become a bullish signal, pointing to past periods where extreme fear preceded sharp rebounds.
Overall, however, bearish commentary currently outweighs optimistic takes, with many investors expecting further downside rather than a quick recovery.
Take that for what is. But just because the majority are leaning on way, it doesn’t always mean that they are wrong.
CappNotes offers a small window into the work we do at CappThesis - a technical analysis newsletter company focused on classical chart patterns, trend, and risk management. Explore the full range of CappThesis services here: