


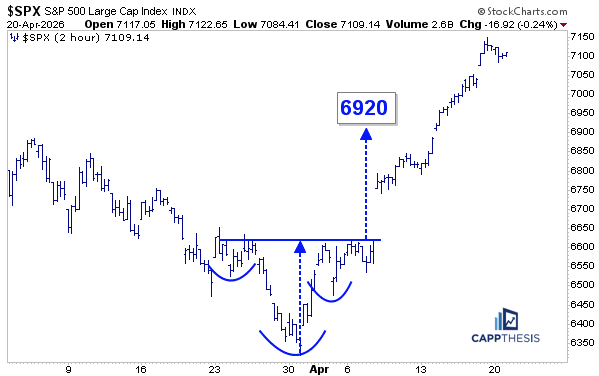
Before we get to the meat of today’s note, here’s a quick SPX update. The index has now reached its second bullish pattern target since the reversal commenced in late March.
The first successful pattern saw the 6,920 objective achieved in early April…
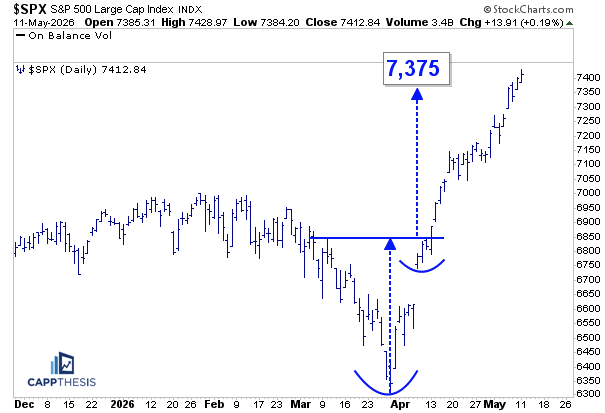
…and now the second target — 7,375 — which was reached this past Friday.
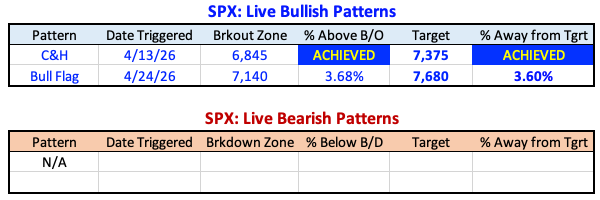
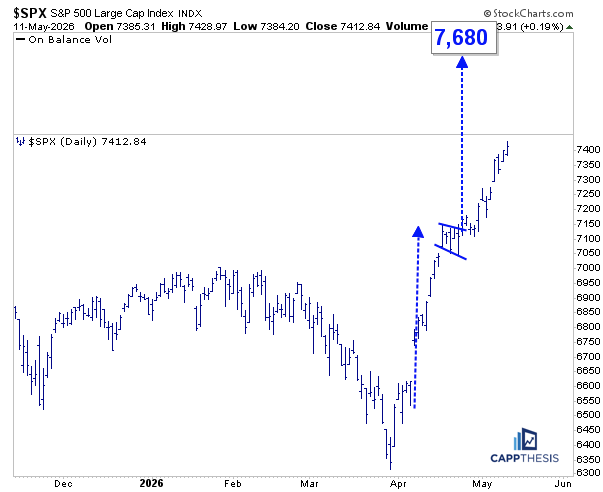
That leaves us with one remaining live bullish pattern: the bull flag, which carries an upside target near 7,680.
Seeing two straight bullish patterns successfully play out is constructive for the uptrend to persist. Successful breakouts help build a stronger technical foundation, from which additional bullish continuation patterns can develop.
We’ve already seen this dynamic unfold over the last several weeks, and it has played out many times historically as well: the SPX experiences an initial burst of buying following a correction, then transitions into a steadier, more persistent uptrend as momentum consolidates and resets along the way.
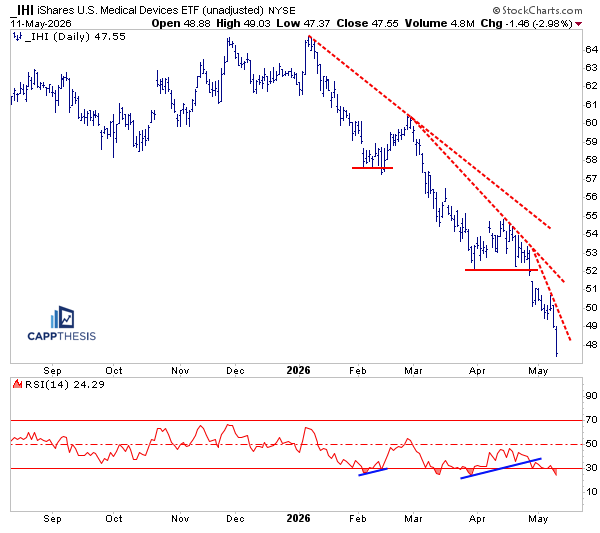
IHI Medical Devices – When downside momentum takes over
IHI got hit hard again yesterday, falling another 3% and making a fresh 52-week low. This serves as another reminder that, while indicators can be helpful, trend and price action ultimately matter most.
As is clear, IHI has been in a decisive downtrend since the very start of 2026. Along the way, we’ve noted its persistent underperformance and also highlighted two potential positive momentum divergences, most recently in late April.
However, neither has mattered in any meaningful way. Instead, momentum has only produced brief pockets of relief, with rallies quickly fading and no true change in character emerging.
The lesson here is simple: positive divergences alone are not enough. Until price can begin making higher highs and higher lows — or at least stop breaking support — the trend remains down.
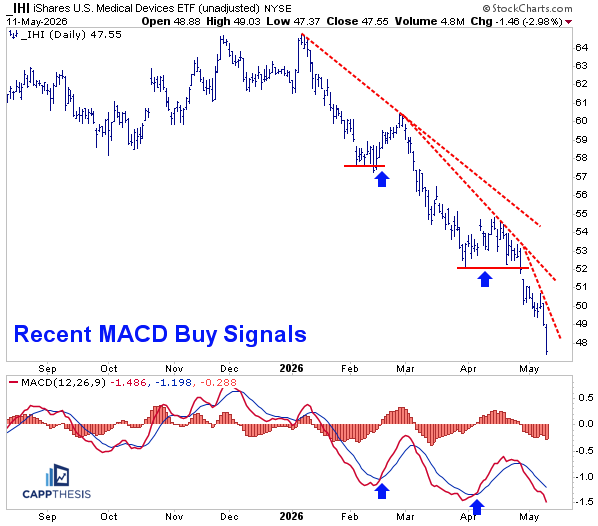
IHI Medical – Failed MACD Buy Signals
Those prior bounce attempts were also accompanied by MACD buy signals, both of which ultimately failed to produce anything more than short-lived relief rallies. With IHI again approaching oversold territory, another bounce attempt could soon trigger yet another MACD buy signal.
Of course, every setup is different, and eventually one of these signals will stick. However, given the repeated failures and the ETF’s persistent downtrend, traders will likely need to see far more upside follow-through before trusting another oversold rally.
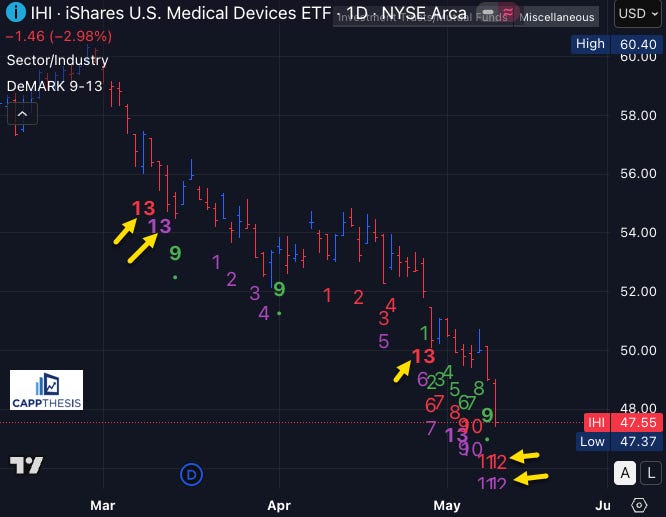
IHI – Failed DeMARK Buy Signals
I’ve been tracking DeMark indicators more closely recently given how extreme many of the recent moves have been, particularly to the upside. One key takeaway is that, when trends become especially strong, counter-trend signals often struggle to work. We’ve seen that repeatedly with sell “13” signals during strong uptrends, and the same principle applies in sharp downtrends.
In IHI’s case, buy “13” signals appeared in March, but aside from a brief respite, the downtrend quickly resumed. The same thing happened again in April. And as is clear on the chart, we could now be approaching two additional buy “13” signals in the coming days.
At some point, one of these signals — especially when paired with the oversold readings and momentum divergences discussed above — may finally lead to a more durable bounce. But relying on indicators alone during a strong trend, whether up or down, ignores the most important factor: price action. Until the chart itself begins to improve, the trend deserves the benefit of the doubt.
CappNotes offers a small window into the work we do at CappThesis - a technical analysis newsletter company focused on classical chart patterns, trend, and risk management. Explore the full range of CappThesis services here: