


TGIF,
Below is an excerpt from today's Opening Look.
Also check our latest LinkedIn post:
Why is now the right time to use short-term charts?
I think we all know the answer—volatility is fierce, and the only way to detect bullish patterns in the very early stages of a potential comeback is to zoom in.
There are various time frames to choose from. Let’s start with the 60-minute version, which clearly shows he two recent tests of the 4800 area just this week—first on Monday, and then the explosive rally on Wednesday. Yesterday’s pullback then created a potential higher low. Put that all together, and it’s starting to look like a potential bullish cup-and-handle is forming.
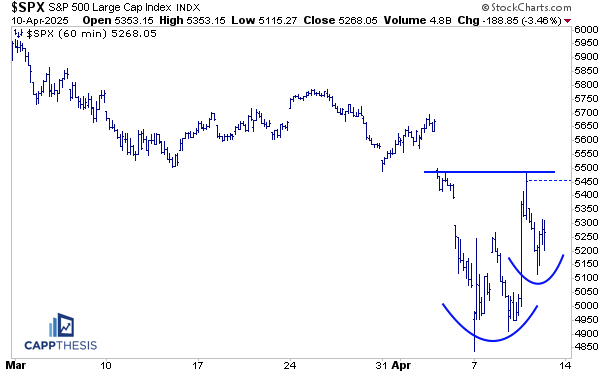
Another reason the short-term view matters: the moves are so big right now even intraday charts are bigger than we sometimes see across multiple weeks of price action.
So yes, there’s still a lot of work to do, but this timeframe gives us the best shot at judging price structure in real-time, especially compared to a daily chart, where the bars are all crunched together and it’s harder to see the nuance.
So, what needs to happen for this pattern to play out? First, 5500 is key—that’s the clear top of this potential formation. Second, we need to hold yesterday’s low to keep this setup intact. And finally, we need some real follow-through from here.
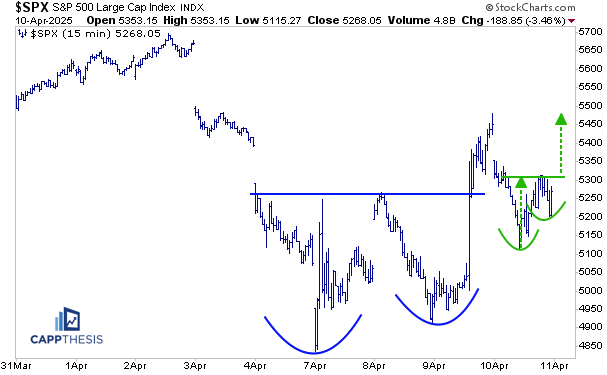
It can get there by leveraging this much smaller cup and handle pattern on the 15-minute chart. While the preceding double-bottom breakout was negated yesterday, the SPX did notch a higher low, which it will be trying to leverage today.
There’s plenty of work ahead—and yes, the patterns will continue to morph. But the only way to truly stay on top of these developments is by watching the very short-term charts, which we’ll continue to reference closely.
(We’ll also be providing intra-day updates in our Slack channel for Professional subscribers.)
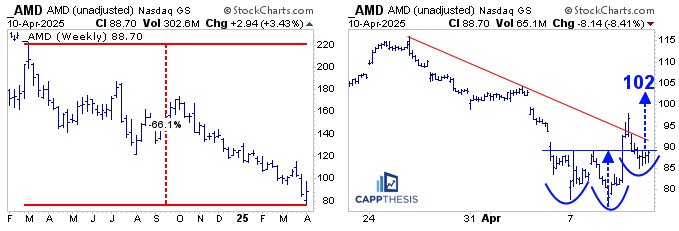
AMD
AMD has dropped 65% since topping in March 2024, and despite a few rally attempts, it’s consistently failed to challenge its long-term downtrend—especially since the steady decline began last October.
A closer look at the 60-minute chart shows some potential signs of life. The initial double bottom breakout was negated, but if the stock can reclaim the 90-zone, the breakout would be retriggered, opening the door to a measured move toward 102.
That kind of move wouldn’t put much of a dent in the long-term downtrend, but it would represent a respectable short-term advance—and potentially a starting point if AMD is going to begin clawing back from a brutal 13-month stretch…
Kaboom
Thanks Frank
I so appreciate receiving your complimentary notes. Your explanations are more comprehensive than other technical analysts on CNBC and elsewhere. I must admit I don’t understand everything, but I feel I am getting educated reading your posts. Thanx again!😀