


Good morning - This was written pre-market today. While the charts look a lot different with the massive rebound attempt so far on Monday morning, the arguments and studies discussed remain important to monitor in the near-term.
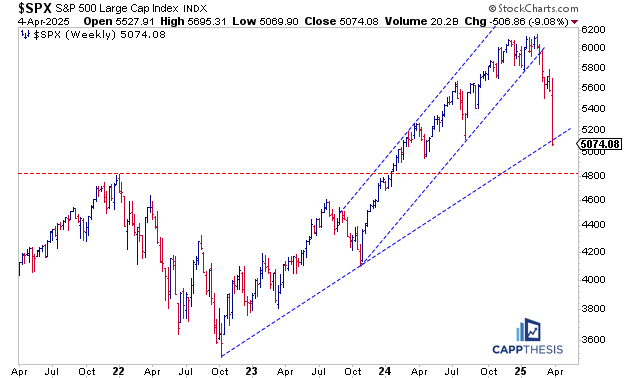
Weekly Key Levels
This is the true definition of price and support discovery—which has been on full display in real-time and happening at an historic clip. When the first real rally effort shows up, it’ll be obvious in hindsight.
Will it occur at a “key level” or not? With other levels getting aggressively washed out, I’m getting fewer questions about support—and rightly so.
Is this a contrarian indicator? Maybe… Either way, we need to stay vigilant and ready for anything.
With the SPX now having broken below the trading channel off the October ’23 low, it closed Friday just beneath the uptrend line from the October ’22 low.
That leaves a clear air pocket down to 4,800—the 2021 high. Let’s not forget: that was also the breakout point from the big bullish pattern that targeted 6,100.
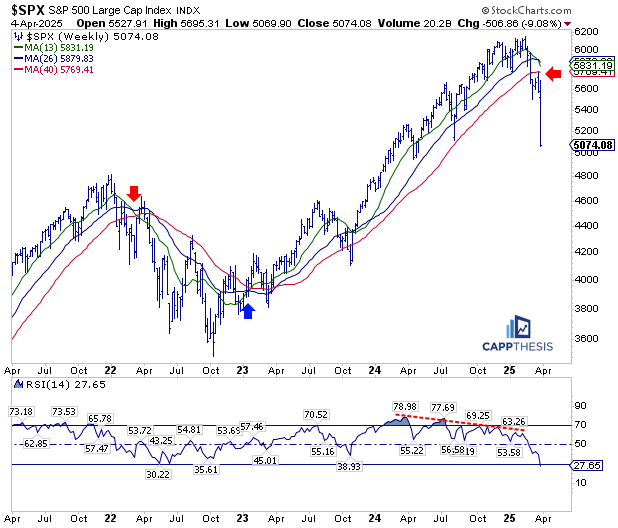
Weekly Moving Averages
The weekly moving averages are curling over – again similar to 2022 – and now have become clear resistance lines. They will come into play at some point again soon.
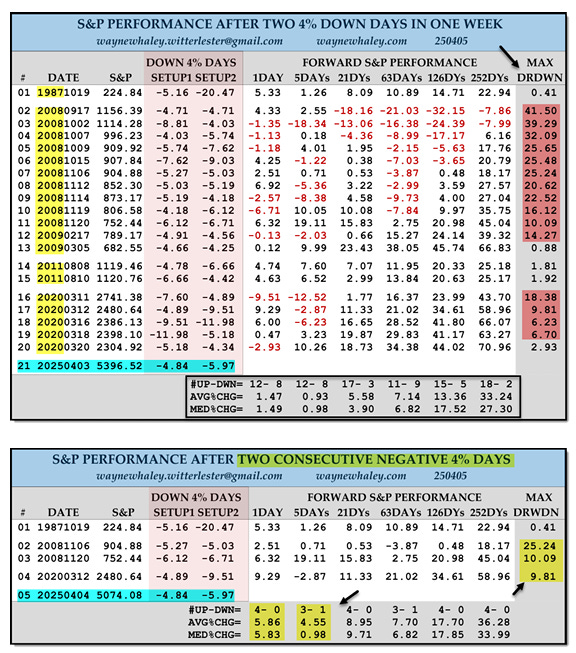
After Two 4% Declines
Here’s a study from Wayne Whaley showing what has happened after two 4% losses in a calendar week AND two straight 4% declines since 1987. The takeaway is that it’s long-term bullish, but with some big drawdowns along the path to get there.
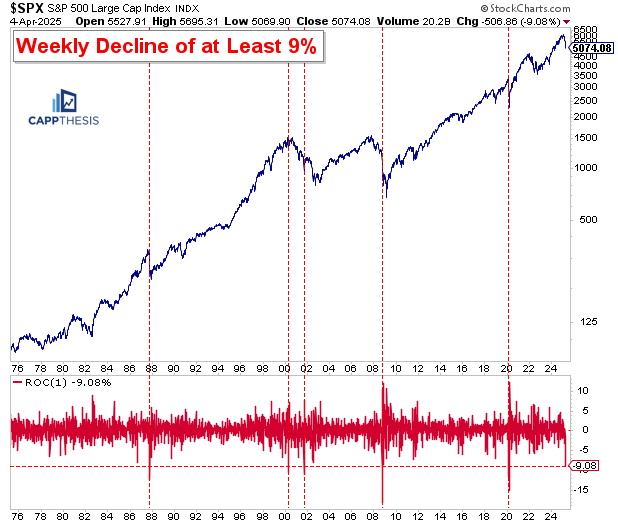
Weekly Decline of at Least 9%
Nine percent weekly declines are rare. They only happen in bear markets—and we know every one of these periods well. The 2025 version now ranks among the worst. Two-way volatility was fierce before and after the prior occurrences. Expect the same now.
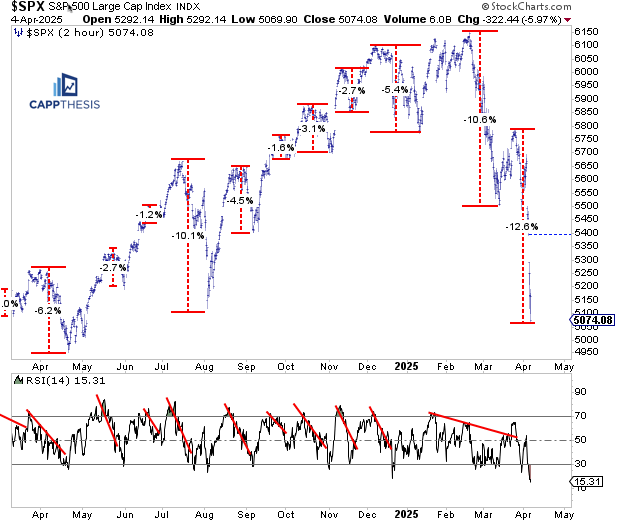
Short-term
The 14-period RSI on the 2-hour chart dropped to 15 by Friday’s close—the lowest reading since COVID. Importantly, the indicator hasn’t been overbought since late January—a clear tell during the last few failed rebounds.
That’s still the case today. It remains a reliable short-term gauge as this market works through another potential rebound attempt.
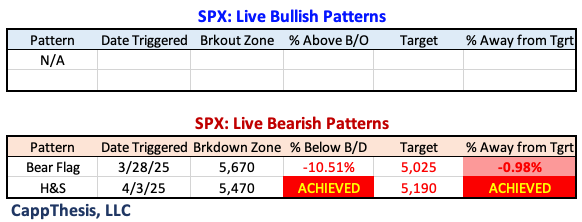
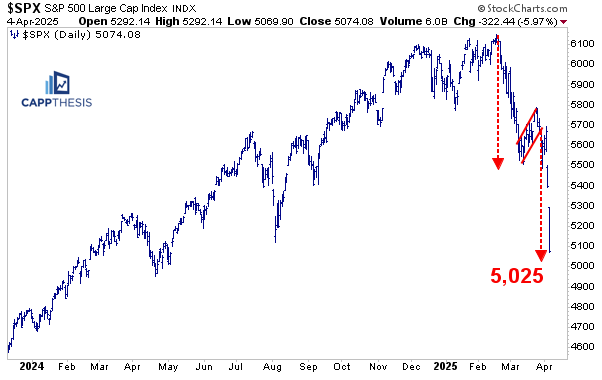
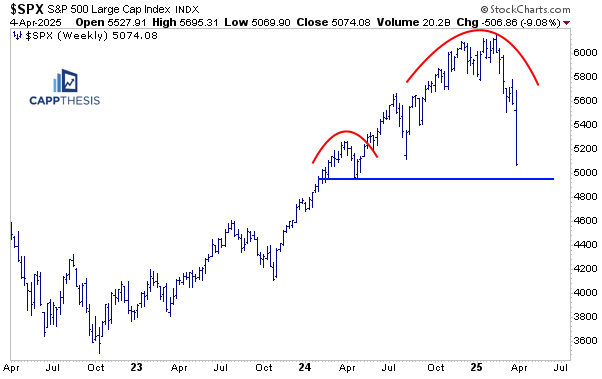
The 5,190 head & shoulders target was hit on Friday…
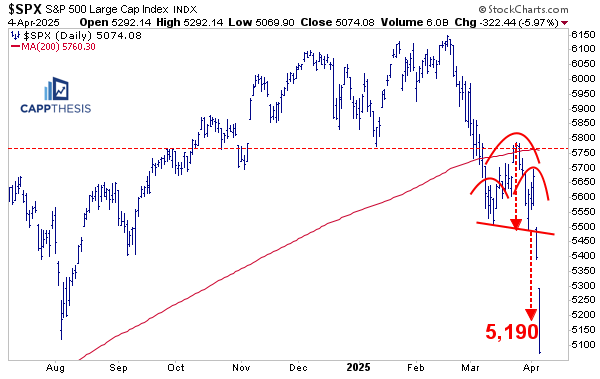
With the flag target of 5,025 being next.
Looking ahead—whenever and wherever the next bounce materializes—a lower high will be etched. At that point, a much larger topping pattern may continue to take shape. Whether that gets leveraged or not will be the question we’ll be addressing at that time.
There’s a lot more going beyond the S&P 500, which appears in the second part of the report…
Great analysis. Today’s bump … short covering. Put on the seatbelt and helmet for crash injury avoidance. Don’t be the crash dummy with this tariff clash with reality.